. 2011 Dec;22(24):4854-67.
doi: 10.1091/mbc.E11-07-0592. Epub 2011 Oct 12.

The schizophrenia susceptibility factor dysbindin and its associated complex sort cargoes from cell bodies to the synapse

Affiliations

The schizophrenia susceptibility factor dysbindin and its associated complex sort cargoes from cell bodies to the synapse

Jennifer Larimore et al. Mol Biol Cell. 2011 Dec.

Abstract

Dysbindin assembles into the biogenesis of lysosome-related organelles complex 1 (BLOC-1), which interacts with the adaptor protein complex 3 (AP-3), mediating a common endosome-trafficking route. Deficiencies in AP-3 and BLOC-1 affect synaptic vesicle composition. However, whether AP-3-BLOC-1-dependent sorting events that control synapse membrane protein content take place in cell bodies upstream of nerve terminals remains unknown. We tested this hypothesis by analyzing the targeting of phosphatidylinositol-4-kinase type II α (PI4KIIα), a membrane protein present in presynaptic and postsynaptic compartments. PI4KIIα copurified with BLOC-1 and AP-3 in neuronal cells. These interactions translated into a decreased PI4KIIα content in the dentate gyrus of dysbindin-null BLOC-1 deficiency and AP-3-null mice. Reduction of PI4KIIα in the dentate reflects a failure to traffic from the cell body. PI4KIIα was targeted to processes in wild-type primary cultured cortical neurons and PC12 cells but failed to reach neurites in cells lacking either AP-3 or BLOC-1. Similarly, disruption of an AP-3-sorting motif in PI4KIIα impaired its sorting into processes of PC12 and primary cultured cortical neuronal cells. Our findings indicate a novel vesicle transport mechanism requiring BLOC-1 and AP-3 complexes for cargo sorting from neuronal cell bodies to neurites and nerve terminals.


Figures
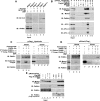
FIGURE 1:
FIGURE 1:
Dysbindin coprecipitates BLOC-1 subunits, AP-3 complexes, and PI4KIIα. (A) Wild-type (Pldn+/+, odd lanes) or pallidin-deficient (Pldnpa/pa, even lanes) mouse skin primary culture fibroblasts were treated with DSP, detergent solubilized, and extracts precipitated with magnetic beads with antibodies against AP-3 delta (lanes 3–6) in either the absence (lanes 5 and 6) or presence (lanes 3 and 4) of delta antigenic peptide as an immunoprecipitation control. (B) SH-SY5Y stably expressing triple FLAG dysbindin treated in the absence or presence of DSP were solubilized in detergent and extracts precipitated with magnetic beads alone as controls (lanes 3–6), with antibodies against FLAG tag (lanes 7–10). Precipitations were performed in the absence or presence of an excess of FLAG peptide (lanes 9 and 10). An irrelevant antibody (SV2, lanes 5 and 6) was used to confirm specificity. (C) SH-SY5Y FLAG dysbindin or (D) SH-SY5Y FLAG muted cell extracts were precipitated with PI4KIIα antibodies (lanes 3, 4, and 3′–5′) in either the absence or presence of PI4KIIα peptide 51-70 to outcompete binding of PI4KIIα complexes to beads (first Competition [Comp.], lanes 4 and 4′). Protein complexes bound to beads were eluted with SDS–PAGE sample buffer (lanes 2-–4). The band detected in PI4KIIα blots in lanes 1 and 4 corresponds to the rabbit anti-PI4KIIα immunoglobulin G also used for immunoprecipitation. Alternatively, PI4KIIα protein complexes were eluted from beads with buffer in either the absence (lane 3′) or presence of 200 μM PI4KIIα peptide 51-70 (second elusion, lane 5′). (E) Untransfected SH-SY5Y (lanes 1, 2, 5, and 6) or SH-SY5Y FLAG muted cells treated in the absence or presence of DSP were solubilized in detergent and extracts were precipitated with FLAG antibodies (lanes 5–8), and FLAG muted protein complexes were eluted from beads with 200 μM FLAG peptide (lanes 5–8). Note that PI4KIIα coprecipitates with FLAG-tagged muted even in the absence of DSP (lane 7). Specificity was determined by using cell extracts from nontransfected cells (lanes 5 and 6). Immune complexes resolved by SDS–PAGE were analyzed by immunoblot with antibodies against FLAG, the BLOC-1 subunits pallidin and muted, AP-3 subunits (δ, β3, σ3), and PI4KIIα. Inputs are 10%, and in B–D inputs are lanes 1 and 1′.
FIGURE 2:
FIGURE 2:
Dentate gyrus PI4KIIα content is reduced in the neuropil of BLOC-1– and AP-3–deficient mice. The dentate gyrus of the hippocampal formation from 6- to 8-wk-old control (A–D), BLOC-1–deficient sandy (Dtnbp1sdy/sdy), muted (Mutedmu/mu), and pallid (Pldnpa/pa) and AP-3–deficient mocha (Ap3d1mh/mh) mice was stained with antibodies against PI4KIIα (green) and the synaptic vesicle marker synaptophysin (red). (E) Total pixels for synaptophysin and PI4KIIα were quantified by MetaMorph analysis and expressed as a ratio of PI4KIIα to synaptophysin pixel counts. Numbers in parentheses represent the number of independent sections stained from three animals. *p < 0.0001; **p < 0.005. Bar, 50 μm.
FIGURE 3:
FIGURE 3:
PI4KIIα content in synaptosomes of AP-3–deficient mocha mice is reduced. (A) Synaptosome fractions from control brains (lanes 1–8) and AP-3–deficient mocha (Ap3d1mh/mh) brains (lanes 1′–8′) were resolved on SDS–PAGE, and the contents were analyzed by immunoblot with antibodies against synaptic vesicle markers (SV2, synaptophysin), AP-3–dependent synaptic vesicle cargoes (PI4KIIα, VAMP7, ZnT3), and AP-3 σ3 subunit. (B) Quantification of antigen content expressed as a ratio of the heavy synaptosome fraction from control and AP-3–deficient mocha (Ap3d1mh/mh) brains. Numbers in parentheses represent the number of independent immunoblots performed from three independent fractionations. *p < 0.0001; **p = 0.0157. HS, heavy synaptosomes; LS, light synaptosomes; Mit, mitochondrial-enriched fractions obtained from Percoll gradients; P1 and P2, low- and high-speed pellets, respectively. Fractions were generated as per Nagy and Delgado-Escueta (1984).
FIGURE 4:
FIGURE 4:
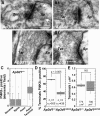
PI4KIIα is present in synapses, and its presynaptic levels are decreased in AP-3–null brains (Ap3d1mh/mh). (A, A1) PI4KIIα immunoperoxidase labeling in the active zone of axon terminals forming asymmetric, axospinous synapses in the dentate gyrus of a wild-type mouse (Ap3d1+/+). (B, B1) The lack of such labeling in a AP-3–null mocha mouse (Ap3d1mh/mh). Note that the spine in A also displays a low level of immunoreactivity (arrows). (C) Relative prevalence of neural elements immunoreactive for PI4KIIα in random fields of view of the dentate gyrus taken at a magnification of 75,000× in three wild-type animals. One hundred thirty-four dentate gyrus fields were analyzed from three mice. (D) Percentage of PI4KIIα-positive terminals over the total number of asymmetric synapses counted in control and AP-3–null mocha (Ap3d1mh/mh) dentate gyrus sections. Here, n1 corresponds to number of animals, and n2 is the number of terminals scored per genotype. Note the significant difference in percentage of labeled terminals between wild-type and AP-3–null mocha mice. (F) Total number of axon terminals forming axospinous, asymmetric synapses per square micron of dentate gyrus tissue in three control and three AP-3–null mocha (Ap3d1mh/mh) mice. Numbers in the boxplot are the total area of tissue analyzed. Scale bars, 200 nm.
FIGURE 5:
FIGURE 5:
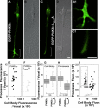
PI4KIIα targeting to neurites in PC12 cells requires the PI4KIIα dileucine-sorting motif. PC12 cells expressing wild-type EGFP-PI4KIIα (A, B; n = 17 cells) or EGFP-PI4KIIαL60-61A (C, D; n = 15 cells) tagged with EGFP were NGF differentiated for 48–72 h posttransfection and cells were imaged in vivo. (B, D) DIC images. (A1, C1) Enlarged view of neurite tips in A and C. (E, F) Fluorescence intensity per voxel was measured for wild-type PI4KIIα-expressing (closed circles) and PI4KIIαL60-61A-expressing (open circles) cells both in cell bodies and their processes. (H,G) Comparison of fluorescence intensity between PI4KIIα- and PI4KIIαL60-61A–expressing cells from E and F for cell bodies and processes, respectively. (I) Transfected cells were stained for VAMP2 and EGFP and imaged by confocal fluorescence microscopy. Fluorescent pixels present in cell body and processes were quantified for both VAMP2 and transfected PI4KIIα. Closed symbols depict data from cells expressing wild-type PI4KIIα (n = 26 cells), whereas open symbols depict fluorescent pixels from cells expressing PI4KIIαL60-61A (n = 26). Circles and triangles represent EGFP and VAMP2 fluorescence values, respectively. In E, F, and I, each point depicts the fluorescence intensity in processes and cell body of individual cells as in terms of x, y coordinates. Data were collected from three independent experiments. Bars, 10 μm.
FIGURE 6:
FIGURE 6:
Distinct mechanisms mediate the delivery of wild-type and dileucine mutant PI4KIIα into neurites. (A) Look-up table (LUT) of photobleached neurite tips of PC12 cells expressing EGFP-PI4Kα, EGFP-PI4KIIαL60-61A, or EGP-GAP43-ps. In vivo images were taken before (Pre), during photobleaching (0') and every 5 min thereafter for 30 min, after which an image was acquired every 15 min for an additional 45 min. (B, C) Time course of neurite tip fluorescence intensity (%) during FRAP, normalized to their fluorescence intensity before photobleaching. (B) EGFP-PI4KIIαL60-61A (n = 14 cells) recovers faster than EGFP-PI4Kα (n = 23 cells) following photobleaching, reaching a plateau within 10 min vs. 45 min, respectively. (C) No differences are observed in the time course of recovery between EGFP-PI4KIIαL60-61A and EGP-GAP43-ps (n = 8 cells). Scale bars, 20 μm.
FIGURE 7:
FIGURE 7:
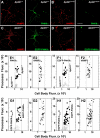
PI4KIIα targeting to neuronal processes is impaired in AP-3–deficient mocha (Ap3d1mh/mh) neurons. Primary cultured forebrain P4 neurons from wild-type (Ap3d1+/+) (A, C) or AP-3–deficient mocha mice (Ap3d1mh/mh) (B, D) either untransfected (A, B) or transfected (C, D) with EGFP-PI4KIIα were cultured for 7DIV. Cells were stained for VAMP2 (red) and either EGFP (green) or endogenous PI4KIIα (green) and imaged by confocal fluorescence microscopy. Fluorescent pixels present in the cell body and processes were quantified for both VAMP2 and either endogenous (E) or transfected PI4KIIα (F) and presented as cell body–to–processes fluorescence intensity x, y coordinates. Closed symbols depict data from wild-type neurons, whereas open symbols depict fluorescent pixels from AP-3–null mocha neurons. Circles and triangles represent PI4KIIα and VAMP2 fluorescence values, respectively. Each point represents an individual neuron. (G, H) Primary cultured forebrain P4 neurons from wild-type mice expressing PI4KIIα or PI4KIIαL60-61A tagged with EGFP were cultured for either 7DIV (H) or 3DIV (G). Cells were stained for VAMP2 and EGFP and imaged by confocal fluorescence microscopy. Fluorescent pixels present in cell body and processes were quantified for both VAMP2 and transfected PI4KIIα (G, H). Closed symbols depict data from cells expressing wild-type PI4KIIα, whereas open symbols depict fluorescent pixels from cells expressing PI4KIIαL60-61A. Circles and triangles represent EGFP and VAMP2 fluorescence values, respectively. E1, E2, n = 20 cells; F1, F2, n = 20 wild-type and AP-3–null cells (Ap3d1mh/mh); G1, G2, n = 24 EGFP-PI4KIIα–transfected cells and n = 20 EGFP-PI4KIIαL60-61A–transfected cells; H1, H2, n = 49 EGFP-PI4KIIα–transfected and n = 45 EGFP-PI4KIIαL60-61A–transfected cells. All neurons were obtained from three independent experiments. Scale bars, 50 μm.
FIGURE 8:
FIGURE 8:
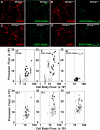
PI4KIIα targeting to neuronal processes is impaired in BLOC-1–deficient neurons. Primary cultured forebrain neurons from control (Dtnbp1+/+) (A, B) or dysbindin-BLOC-1–deficient sandy mice (Dtnbp1sdy/sdy (C, D) either not transfected (E) or transfected with EGFP-PI4KIIα (A, C) or EGFP-PI4KIIαL60-61A (B, D) were cultured for 7DIV. Cells were stained for VAMP2 (red) and PI4KIIα for untransfected cells or VAMP2 and EGFP (green) for transfected cells. Fixed cells were imaged by confocal fluorescence microscopy. Fluorescent pixels present in cell body and processes were quantified for VAMP2 (E1, F1, G1), endogenous PI4KIIα (E), and transfected PI4KIIα (F, G) cells. Closed circles depict PI4KIIα or EGFP fluorescent pixels from wild-type neurons, whereas open circles depict pixels from dysbindin-BLOC-1–null sandy neurons. Closed triangles depict VAMP2 fluorescent pixels from wild-type neurons, whereas open triangles depict pixels from dysbindin-BLOC-1–null sandy neurons. Each point represents an individual neuron. Twenty neurons per condition were obtained from three independent experiments. Scale bars, 50 μm.

Similar articles

Cited by

References

    1. Allen NC, Bagade S, McQueen MB, Ioannidis JP, Kavvoura FK, Khoury MJ, Tanzi RE, Bertram L. Systematic meta-analyses and field synopsis of genetic association studies in schizophrenia: the SzGene database. Nat Genet. 2008;40:827–834. - PubMed
    1. Barylko B, Mao YS, Wlodarski P, Jung G, Binns DD, Sun HQ, Yin HL, Albanesi JP. Palmitoylation controls the catalytic activity and subcellular distribution of phosphatidylinositol 4-kinase II. J Biol Chem. 2009;284:9994–10003. - PMC - PubMed
    1. Bhardwaj SK, Baharnoori M, Sharif-Askari B, Kamath A, Williams S, Srivastava LK. Behavioral characterization of dysbindin-1 deficient sandy mice. Behav Brain Res. 2009;197:435–441. - PubMed
    1. Bonifacino JS, Glick BS. The mechanisms of vesicle budding and fusion. Cell. 2004;116:153–166. - PubMed
    1. Borck G, et al. Clinical, cellular, and neuropathological consequences of AP1S2 mutations: further delineation of a recognizable X-linked mental retardation syndrome. Hum Mutat. 2008;29:966–974. - PubMed

Publication types

MeSH terms