. 2011 Oct 17;195(2):323-40.
doi: 10.1083/jcb.201107053. Epub 2011 Oct 10.

A mitochondrial-focused genetic interaction map reveals a scaffold-like complex required for inner membrane organization in mitochondria

Affiliations

A mitochondrial-focused genetic interaction map reveals a scaffold-like complex required for inner membrane organization in mitochondria

Suzanne Hoppins et al. J Cell Biol. .

Abstract

To broadly explore mitochondrial structure and function as well as the communication of mitochondria with other cellular pathways, we constructed a quantitative, high-density genetic interaction map (the MITO-MAP) in Saccharomyces cerevisiae. The MITO-MAP provides a comprehensive view of mitochondrial function including insights into the activity of uncharacterized mitochondrial proteins and the functional connection between mitochondria and the ER. The MITO-MAP also reveals a large inner membrane-associated complex, which we term MitOS for mitochondrial organizing structure, comprised of Fcj1/Mitofilin, a conserved inner membrane protein, and five additional components. MitOS physically and functionally interacts with both outer and inner membrane components and localizes to extended structures that wrap around the inner membrane. We show that MitOS acts in concert with ATP synthase dimers to organize the inner membrane and promote normal mitochondrial morphology. We propose that MitOS acts as a conserved mitochondrial skeletal structure that differentiates regions of the inner membrane to establish the normal internal architecture of mitochondria.


Figures

Figure 1.
Figure 1.
Generation of the MITO-MAP. (A) Manually defined functional annotations for genes included in the MITO-MAP are summarized in pie charts: 592 genes whose products are predicted to localize to the mitochondria, 437 genes whose products are predicted to localize to the early secretory pathway (ESP), and 529 other genes. Localization groups were based on systematic results with GFP-tagged proteins and GO Slim component annotations. (B) Scatter plot of all full biological replicate genetic interaction score (S-score) measurements for double mutants generated from each of the two possible query-array parent strain combinations. The Pearson correlation for these replicates was 0.65.
Figure 2.
Figure 2.
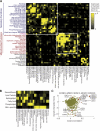
Structure of genetic interactions within and between mitochondria and the secretory pathway. (A) A heat map of log10 P-values for the enrichment of synthetic genetic interactions (S-score < −3) between genes annotated as functioning in different pathways of the secretory system, mitochondria, or related pathways. Genes were manually assigned a single annotation based on curation of the literature (Table S2). Enrichment P-values were calculated using the binomial distribution as the probability of observing as many or more synthetic interactions between genes with the indicated annotations, given the number of measurements and an expected probability of synthetic interaction that accounts for the overall interaction frequency for each annotation (see Materials and methods for more details). Enrichment P-values were calculated after accounting for the overall frequency of interactions for each annotation. (B) A heat map of enrichments of synthetic interactions (as in A) for the different major branches of the cellular lipid biosynthesis machinery. (C) Genetic connection scatter plot for the average of ERMES component genes MDM10, MDM12, MDM34, and MMM1. The x axis represents the cosine correlation between the mean of ERMES genes interaction scores, and the y axis indicates the mean interaction score between the ERMES genes and each gene in the MITO-MAP. Every point in the scatter plot represents one gene. The cosine correlation values for points corresponding to the selected genes themselves were computed using the mean of the interaction score vectors for the remaining selected genes. In cases where the genetic interaction score was not measured, the point is plotted in gray along the line y = 0.
Figure 3.
Figure 3.
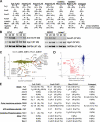
MitOS interacts with both outer and inner mitochondrial membranes. (A) Proteomic analysis of FLAG-tag immunoprecipitations as described in Materials and methods. For each on-bead digest of the indicated FLAG-tag purification or untagged wild type control (top row), the number of peptides (and percent coverage) are shown for each identified protein (left column). Data are represented as the mean ± standard error of three independent experiments. Asterisks indicate data represented as the mean ± standard deviation of two independent experiments. (B) Interdependent protein stability of components of the MitOS complex. The indicated relative amounts of whole-cell extract prepared from the indicated MitOS component FLAG-tag strain were subjected to SDS-PAGE and immunoblotting with α-FLAG, α-Ugo1, and α-G6PDH. (C) Genetic connection scatter plot of the average of MitOS component genes AIM5, AIM13, FCJ1, and AIM37. The x axis represents the cosine correlation between the mean of MitOS genes interaction scores, and the y axis indicates the mean interaction score between MitOS genes and each gene in the MITO-MAP. Every point in the scatter plot represents one gene. The cosine correlation values for points corresponding to the selected genes themselves were computed using the mean of the interaction score vectors for the remaining selected genes. In cases where the genetic interaction score was not measured, the point is plotted in gray along the line y = 0. (D) Genetic interaction scatter plot of the average of genes encoding components of MitOS (x axis) and POR1 (y axis). The x axis represents the mean of the genetic interaction scores of AIM5, AIM13, FCJ1, and AIM37 with each gene in the MITO-MAP, and the y axis indicates the mean interaction score of POR1 and each gene in the MITO-MAP. Significant common negative genetic interactions are highlighted. (E) Proteomic analysis of FLAG-tag immune purifications from cross-linked mitochondria as described in Materials and methods. For each on-bead digest of the indicated FLAG-tag protein or untagged wild-type control (top row), the number of peptides and percent coverage are shown for each identified protein (left column). Data are expressed as the mean ± standard error of three independent experiments.
Figure 4.
Figure 4.
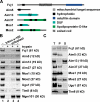
MitOS is a conserved mitochondrial inner membrane–associated complex. (A) Schematic representation of predicted structural features of MitOS components. As described in Materials and methods, the amino acid sequences of MitOS components were subject to bioinformatic analyses to identify conserved features. Fcj1 contains a conserved Mitofilin domain, Mos1 contains a conserved eukaryotic DUF, and Aim37 and Mos2 are both similar to apolipoproteins, predicted to form extended amphipathic α helices (Lamant et al., 2006). Aim13 contains a conserved fungal-specific DUF and a CHCHD-like motif in its C-terminal region, which is marked by two conserved cysteine residues (Cavallaro, 2010). Significantly, a human CHCHD3 protein was reported to be in a complex with Mitofilin isolated from human heart mitochondria (Xie et al., 2007). (B) Protease protection analysis of mitochondria isolated from strains expressing FLAG-tagged versions of MitOS components. Intact mitochondria (lanes 1 and 4), mitoplasts (lane 3), or solubilized mitochondria (lane 2) before treatment with (+) or without (−) trypsin were analyzed by SDS-PAGE and immunoblotting with the indicated antisera. (C) Separation of soluble and membrane proteins by alkaline extraction. Mitochondria were treated with 0.1 M NaCO3 and centrifuged into pellet (P) and soluble (S) fractions, which were analyzed by SDS-PAGE and immunoblotting with the indicated anti-sera. T, total.
Figure 5.
Figure 5.
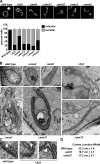
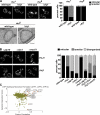
MitOS is required for mitochondrial structure. (A) Wild-type and indicated deletion strains expressing matrix-targeted GFP were grown in SD-dextrose and visualized by fluorescent light microscopy. Representative images of each strain are shown. The graph represents quantification of the mitochondrial morphology in the indicated strains. Data are represented as the mean ± standard error (error bars) of three independent experiments characterizing the mitochondrial morphology of ≥75 cells in each replicate. (B) Wild-type and mutant cells were analyzed by thin-section electron microscopy, and representative images of mitochondria are shown. (C) Representative images of cristae junctions (arrows) observed in wild-type and Δfcj1 cells are shown. (D) Quantification of the widths of cristae junctions observed in electron tomograms of wild-type, Δaim5, and Δaim37 cells. Data are represented as the mean ± standard deviation of three independent measurements. Bars: (A) 2 µm; (B) 200 nm; (C) 20 nm.
Figure 6.
Figure 6.
MitOS and ATP synthase dimers function in concert to control inner membrane structure. (A) Wild-type and Δfcj1 strains with (rho+) or without (rho0) mtDNA expressing matrix-targeted GFP were visualized by light microscopy (top). Representative images are shown. The graph represents quantification of the mitochondrial morphology of the indicated strains. Data are represented as the mean ± standard error of three independent experiments characterizing the mitochondrial morphology of ≥75 cells in each replicate. Rho0 wild-type and Δfcj1 strains were analyzed by EM as described (bottom). Representative images are shown. (B) Indicated strains expressing matrix-targeted GFP were grown in SD-dextrose and visualized by light microscopy. Representative images are shown. Bar, 2 µm. The graph represents quantification of the observed mitochondrial morphology of the indicated strains. Data are represented as the mean ± standard error of three independent experiments (error bars) characterizing the mitochondrial morphology of ≥75 cells in each replicate. (C) Genetic connection scatter plot generated for ATP1, ATP5, and ATP12 as described in Fig. 2 C. Bars: (A, top) 2 µm; (A, bottom) 200 nm; (B) 2 µm.
Figure 7.
Figure 7.
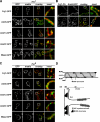
MitOS forms a complex extended scaffold-like structure on the mitochondrial inner membrane. (A) Cells expressing GFP-tagged versions of MitOS components as indicated and mito-dsRed were visualized by light microscopy. Representative images are shown. The boxes indicate the areas shown in the inset. (B) Cells expressing Fcj1-mCherry and Aim5-yeGFP were visualized by light microscopy. Representative images are shown. The boxes indicate the areas shown in the insets. Arrows indicate Fcj1-mCherry puncta. Double arrowheads indicate areas labeled exclusively by Aim5-yeGFP. (C) Rho0 cells expressing GFP-tagged versions of MitOS components as indicated and mito-dsRed were visualized by light microscopy. Representative images are shown. Boxes indicate the areas shown in the inset. Bar, 2 µm. (D) Schematic representation of MitOS localization in mitochondria and its role as an organizer of inner membrane structure. BR, boundary membrane region; CJ, cristae junction; MIM, inner mitochondrial membrane; MOM, outer mitochondrial membrane. Bars, 2 µm.

Similar articles

Cited by

References

    1. Acehan D., Malhotra A., Xu Y., Ren M., Stokes D.L., Schlame M. 2011. Cardiolipin affects the supramolecular organization of ATP synthase in mitochondria. Biophys. J. 100:2184–2192 10.1016/j.bpj.2011.03.031 - DOI - PMC - PubMed
    1. Ackerman S.H., Tzagoloff A. 1990. ATP10, a yeast nuclear gene required for the assembly of the mitochondrial F1-F0 complex. J. Biol. Chem. 265:9952–9959 - PubMed
    1. Aguilar P.S., Fröhlich F., Rehman M., Shales M., Ulitsky I., Olivera-Couto A., Braberg H., Shamir R., Walter P., Mann M., et al. 2010. A plasma-membrane E-MAP reveals links of the eisosome with sphingolipid metabolism and endosomal trafficking. Nat. Struct. Mol. Biol. 17:901–908 10.1038/nsmb.1829 - DOI - PMC - PubMed
    1. Arlt H., Tauer R., Feldmann H., Neupert W., Langer T. 1996. The YTA10-12 complex, an AAA protease with chaperone-like activity in the inner membrane of mitochondria. Cell. 85:875–885 10.1016/S0092-8674(00)81271-4 - DOI - PubMed
    1. Arselin G., Vaillier J., Salin B., Schaeffer J., Giraud M.F., Dautant A., Brèthes D., Velours J. 2004. The modulation in subunits e and g amounts of yeast ATP synthase modifies mitochondrial cristae morphology. J. Biol. Chem. 279:40392–40399 10.1074/jbc.M404316200 - DOI - PubMed

Publication types

MeSH terms

Substances