. 2011 Nov;121(11):4372-82.
doi: 10.1172/JCI57552. Epub 2011 Oct 10.

Ciliogenesis is regulated by a huntingtin-HAP1-PCM1 pathway and is altered in Huntington disease

Affiliations

Ciliogenesis is regulated by a huntingtin-HAP1-PCM1 pathway and is altered in Huntington disease

Guy Keryer et al. J Clin Invest. 2011 Nov.

Abstract

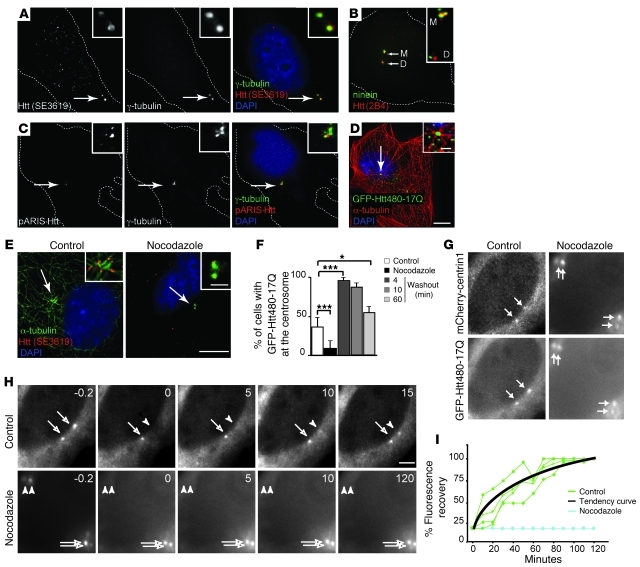
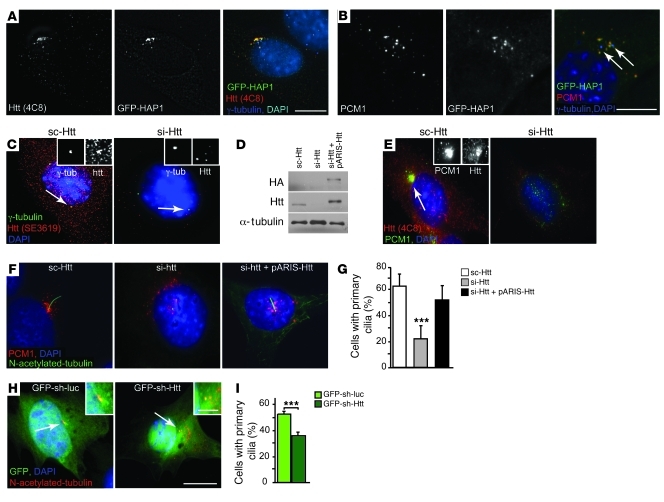
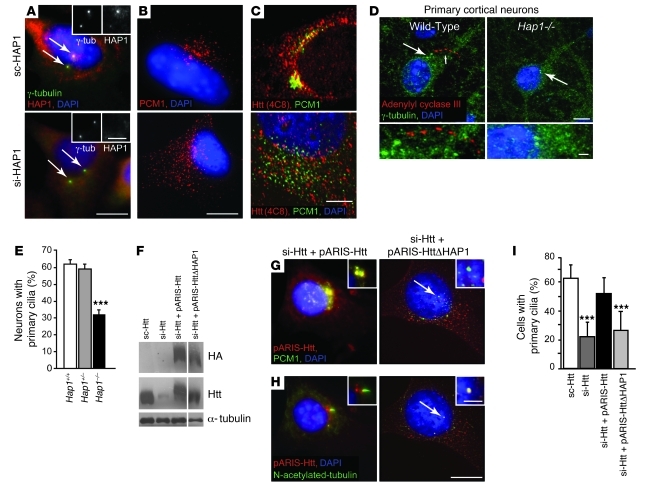
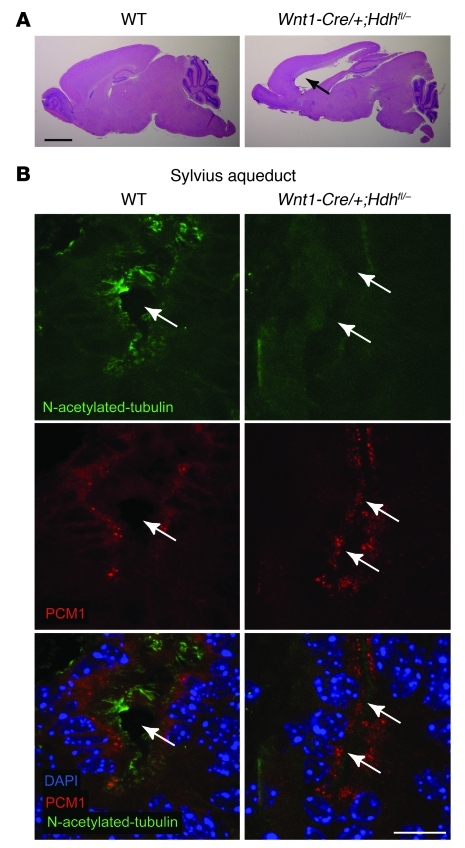
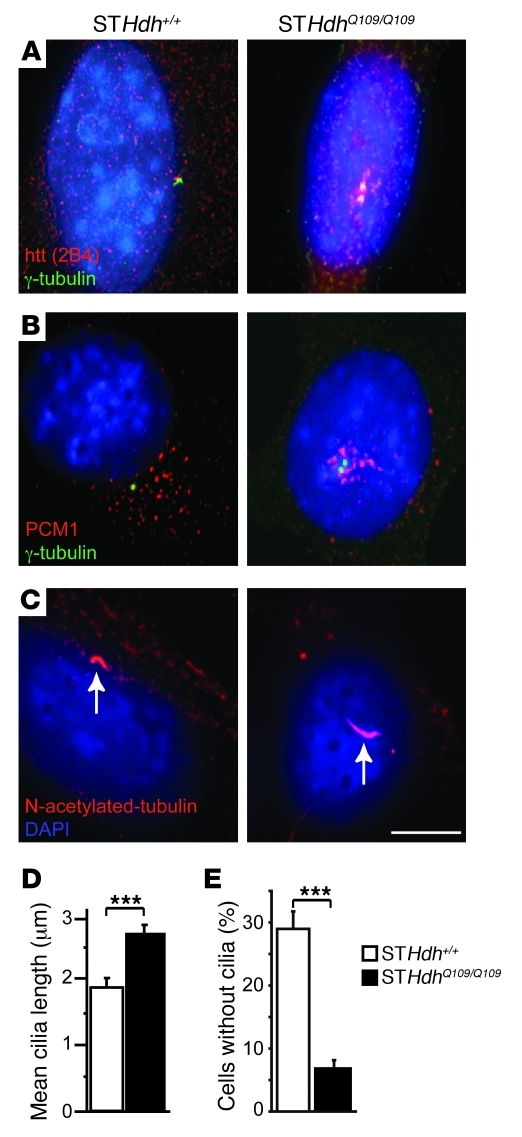
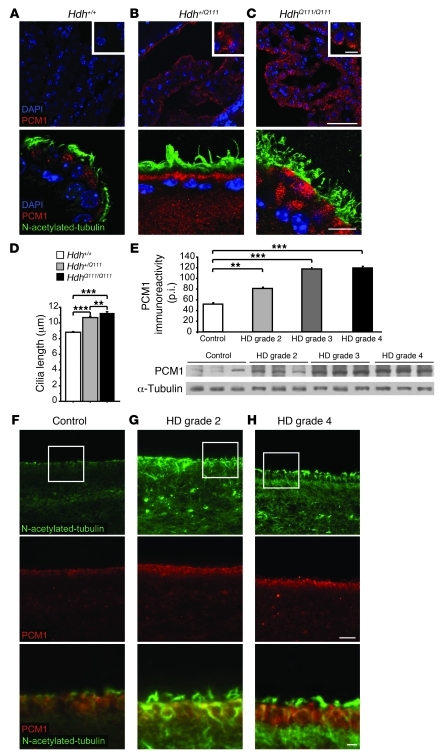
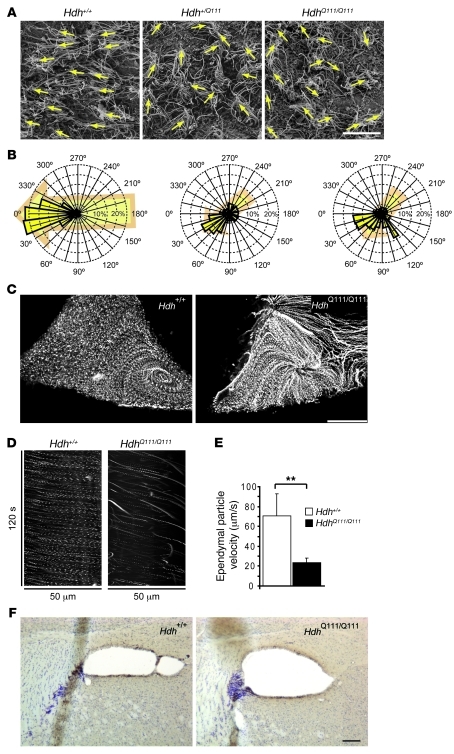
Huntington disease (HD) is a devastating autosomal-dominant neurodegenerative disorder. It is caused by expansion of a CAG repeat in the first exon of the huntingtin (HTT) gene that encodes a mutant HTT protein with a polyglutamine (polyQ) expansion at the amino terminus. Here, we demonstrate that WT HTT regulates ciliogenesis by interacting through huntingtin-associated protein 1 (HAP1) with pericentriolar material 1 protein (PCM1). Loss of Htt in mouse cells impaired the retrograde trafficking of PCM1 and thereby reduced primary cilia formation. In mice, deletion of Htt in ependymal cells led to PCM1 mislocalization, alteration of the cilia layer, and hydrocephalus. Pathogenic polyQ expansion led to centrosomal accumulation of PCM1 and abnormally long primary cilia in mouse striatal cells. PCM1 accumulation in ependymal cells was associated with longer cilia and disorganized cilia layers in a mouse model of HD and in HD patients. Longer cilia resulted in alteration of the cerebrospinal fluid flow. Thus, our data indicate that WT HTT is essential for protein trafficking to the centrosome and normal ciliogenesis. In HD, hypermorphic ciliogenesis may affect signaling and neuroblast migration so as to dysregulate brain homeostasis and exacerbate disease progression.


Figures

Figure 1
Figure 1. Htt associates with centrosome in a MT-dependent manner in mouse STHdh+/+ cells.
(A) Immunostaining with anti-Htt (SE3619) and anti–γ-tubulin and (B) anti-ninein and anti-Htt (2B4) Abs. (C) Anti–γ-tubulin immunostaining of cells expressing pARIS-mCherry-Htt. (D) Anti–α-tubulin immunostaining of cells expressing GFP-Htt480-17Q. (E) Immunostaining of cells in control condition or after MT depolymerization (nocodazole) with anti-Htt (SE3619) and anti–α-tubulin Abs. (AE) Cells were counterstained with DAPI. (F) Quantification of GFP-Htt480-17Q at centrosome in control or nocodazole conditions and after different washout times. n = 3; 750 cells per condition. *P < 0.05; ***P < 0.001. (G) Representative cells expressing mCherry-centrin1 and GFP-Htt480-17Q. The nocodazole-treated cell was in G2 phase (duplicated centrosomes). (H) Representative FRAP experiment of GFP-Htt480-17Q transfected cells in control or nocodazole conditions. (I) FRAP graph. Tendency curve was calculated for 4 bleached centrioles in control condition. Arrows in A, CE, G, and H denote the centrosome. Scale bars: 5 μm; 1 μm (insets).
Figure 2
Figure 2. Htt depletion mislocalizes PCM1 and impairs primary cilia formation in striatal cells.
(A and B) Immunostaining of GFP-HAP1–transfected cells (A) for Htt (4C8) and γ-tubulin and (B) for PCM1. Arrows denote γ-tubulin staining. (C) Immunostaining of cells treated with scrambled RNA (sc-Htt) or siRNA targeting Htt (si-Htt) for Htt (SE3619) and γ-tubulin. (D) Immunoblotting of lysates from sc-Htt cells, si-Htt cells, and si-Htt cells expressing pARIS-Htt. (E) Immunostaining of sc-Htt or si-Htt cells with anti-Htt (4C8) and PCM1 Abs. (F) Immunostaining of cells transfected with sc-Htt, si-Htt, and si-Htt with pARIS-Htt for PCM1 and N-acetylated tubulin. (G) Quantification of primary cilia in cells as in F. n = 4; at least 1,227 cells per condition. ***P < 0.0001. (H) Immunostaining of cells transfected with GFP-sh-luciferase (GFP-sh-luc) and GFP-sh-Htt for N-acetylated tubulin. (I) Quantification of primary cilia in cells as in H. n = 2, at least 430 cells per condition. ***P = 0.001. (AH) Cells were counterstained with DAPI. Scale bars: 5 μm; 1 μm (insets).
Figure 3
Figure 3. Htt regulates PCM1 distribution and ciliogenesis via HAP1.
(AC) STHdh+/+ cells were electroporated with scrambled HAP1 (sc-HAP1) or siRNA targeting HAP1 (si-HAP1). Shown is immunostaining for HAP1 and (A) γ-tubulin, (B) PCM1, (C) and Htt (4C8) and PCM1. (D) Primary cortical neurons from WT or Hap1–/– mice were immunostained for adenylyl cyclase III and γ-tubulin. Large arrow indicates the position of centrosome (green dots); small arrow indicates adenylyl cyclase III–immunopositive cilium. (E) Quantification of primary cilia in neurons from WT (n = 1,062), Hap+/– (n = 1,065), and Hap1–/– (n = 1,312) mice as in D (n = 5 mice per genotype). ***P < 0.0001. (F) Immunoblotting of lysates from sc-Htt cells, si-Htt cells, or si-Htt cells expressing pARIS-Htt or pARIS-HttΔHAP1. Lanes were run on the same gel but were noncontiguous (white line). (G) PCM1 immunostaining of cells electroporated with si-Htt plus pARIS-Htt or si-Htt with the pARIS-HttΔHAP1 vector. (H) N-acetylated tubulin immunostaining of cells as in G. Arrows in G and H denote the position of centrioles. (I) Quantification of primary cilia (at least 610 cells per condition) as in H. ***P < 0.0001. (AC, D, G, and H) Cells were counterstained with DAPI. Scale bars: 5 μm; 1 μm (inset).
Figure 4
Figure 4. Mice lacking Htt in ependymal cells show altered PCM1 distribution, ciliary defects, and hydrocephalus.
(A) Hematoxylin and eosin staining of sagittal sections of WT, Wnt1-Cre/+;Hdhfl/– mice revealed hydrocephalus phenotype in mice lacking Htt. Black arrows indicate hydrocephalus in mutant mice. (B) Immunofluorescence of brain coronal sections showing the Sylvius aqueduct from P15 WT and Wnt1-Cre/+;Hdhfl/– mice stained for N-acetylated tubulin and PCM1 and counterstained for DAPI. Single arrows indicate the aqueduct in WT mice; parallel arrows indicate aqueduct stenosis in mutant mice. Scale bars: 2 mm (A); 10 μm (B).
Figure 5
Figure 5. PolyQ-Htt aggregates PCM1 at centrosome and increases cilia length in striatal cells.
(AC) Immunostainings of mouse STHdh+/+ and STHdhQ109/Q109 cells for (A) Htt (2B4) and γ-tubulin, (B) PCM1 and γ-tubulin, and (C) N-acetylated tubulin showed abnormal accumulation of Htt (A), PCM1 (B), and increased length of cilia (C; arrows) in STHdhQ109/Q109 cells. Cells were counterstained with DAPI. (D) Quantification of mean cilia length in STHdh+/+ and STHdhQ109/Q109 G0-arrested cells (70 cells per group). ***P < 0.001. (E) Quantification of STHdh+/+ and STHdhQ109/Q109 cells with no cilia. ***P < 0.001. Scale bar: 5 μm.
Figure 6
Figure 6. HD mice and patients show aggregation of PCM1 and increased ependymal cilia length.
(AC) Immunohistochemistry of mouse brain longitudinal sections from 1-year-old Hdh+/Q111 (B) and HdhQ111/Q111 (C) mice showed accumulation of PCM1 in the CP (top) and of PCM1 and N-acetylated tubulin in the ependymal layer of the lateral ventricle (bottom) compared with WT mice (A). Scale bars: 50 μm (top); 10 μm (bottom); 4 μm (insets). (D) Increased cilia length in Hdh+/Q111 (81 cilia) and HdhQ111/Q111 (180 cilia) compared with WT Hdh+/+ (201 cilia) mice. **P = 0.001; ***P < 0.0001. (E) Representative Western blot of human postmortem brain lysates from medial caudate nucleus at the ependymal border from HD grade 2, 3, and 4 subjects (n = 8 per group). Graph represents the quantification of PCM1 level in all 24 HD patients samples and 8 age-matched control subjects. p.i., pixel intensity. **P < 0.01; ***P < 0.0001. (FH) Representative striatal sections of HD grade 2 (G), HD grade 4 (H), and age-matched control (F) postmortem brain tissues, with the ependymal lateral ventricle zone showing increased immunoreactivity of N-acetylated tubulin (top) and of PCM1 (middle). Boxed regions are shown at higher magnification at bottom. Scale bars: 50 μm (top and middle); 10 μm (bottom).
Figure 7
Figure 7. Ependymal cilia orientation and flow are altered in HD mice.
(A) Scanning electron microscopy of lateral wall of the lateral ventricle from Hdh+/+, Hdh+/Q111, and HdhQ111/Q111 mice. Arrows indicate the orientation of the cilia tufts. Scale bar: 10 μm. (B) Distribution of cilia orientation around the mean (0°) in lateral ventricles from 3 each of Hdh+/+ (380 tufts analyzed), Hdh+/Q111 (465 tufts), and HdhQ111/Q111 (389 tufts) mice. (C) Ependymal trajectories of particles recorded in the lateral ventricle of 1-year-old Hdh+/+ (1,532 particles) or HdhQ111/Q111 (1,055 particles) mice. Scale bar: 50 μm. (D) Representative kymographs. (E) Quantification of the velocity of particles generated by the ependymal flow. Velocity was calculated from 5 Hdh+/+ mice and 9 HdhQ111/Q111 mice. **P < 0.01. (F) DCX immunostaining along the RMS in coronal brain sections from HdhQ111/Q111 and Hdh+/+ mouse brains. Scale bar: 100 μm.

Comment in

Similar articles

Cited by

References

    1. Borrell-Pages M, Zala D, Humbert S, Saudou F. Huntington’s disease: from huntingtin function and dysfunction to therapeutic strategies. Cell Mol Life Sci. 2006;63(22):2642–2660. doi: 10.1007/s00018-006-6242-0. - DOI - PMC - PubMed
    1. Caviston JP, Ross JL, Antony SM, Tokito M, Holzbaur EL. Huntingtin facilitates dynein/dynactin-mediated vesicle transport. Proc Natl Acad Sci U S A. 2007;104(24):10045–10050. doi: 10.1073/pnas.0610628104. - DOI - PMC - PubMed
    1. Gauthier LR, et al. Huntingtin controls neurotrophic support and survival of neurons by enhancing BDNF vesicular transport along microtubules. Cell. 2004;118(1):127–138. doi: 10.1016/j.cell.2004.06.018. - DOI - PubMed
    1. Colin E, et al. Huntingtin phosphorylation acts as a molecular switch for anterograde/retrograde transport in neurons. Embo J. 2008;27(15):2124–2134. doi: 10.1038/emboj.2008.133. - DOI - PMC - PubMed
    1. Engelender S, et al. Huntingtin-associated protein 1 (HAP1) interacts with the p150Glued subunit of dynactin. Hum Mol Genet. 1997;6(13):2205–2212. doi: 10.1093/hmg/6.13.2205. - DOI - PubMed

Publication types

MeSH terms