. 2011 Sep;8(9):745-52.
doi: 10.1038/nmeth.1668.

Cell type–specific channelrhodopsin-2 transgenic mice for optogenetic dissection of neural circuitry function

Affiliations

Cell type–specific channelrhodopsin-2 transgenic mice for optogenetic dissection of neural circuitry function

Shengli Zhao et al. Nat Methods. 2011 Sep.

Abstract

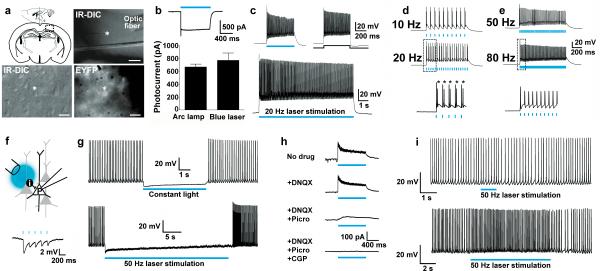
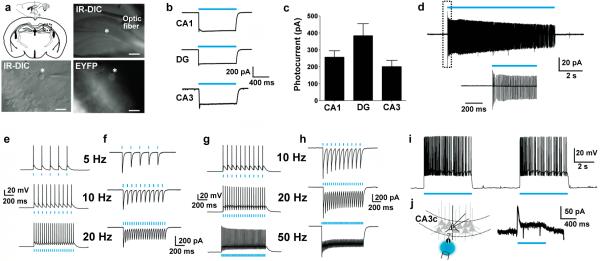
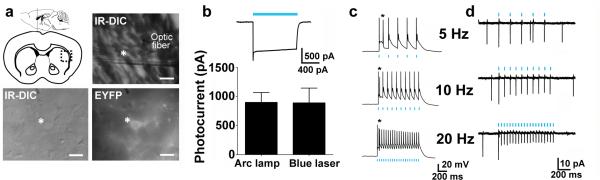
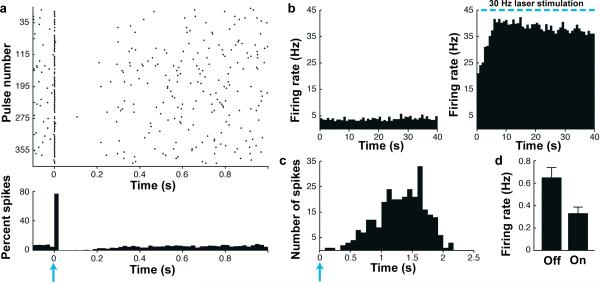
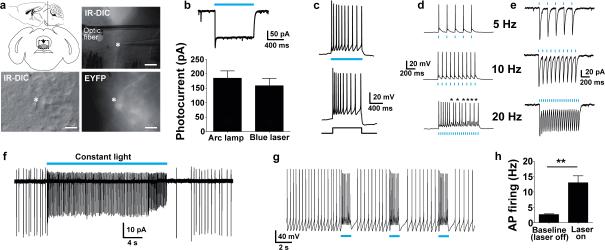
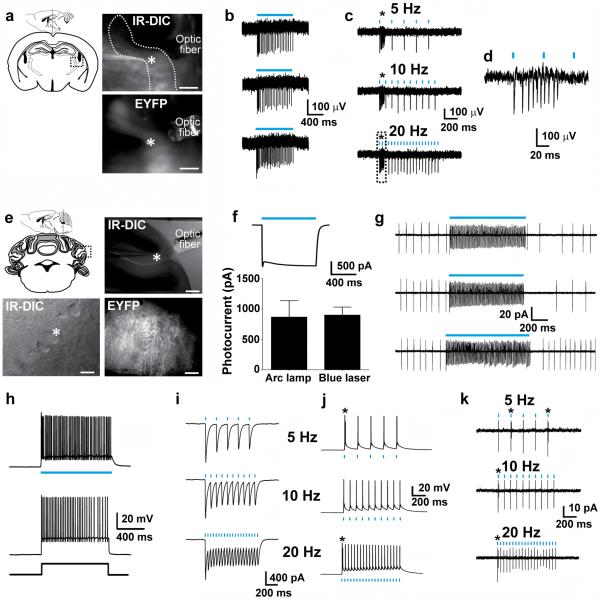
Optogenetic methods have emerged as powerful tools for dissecting neural circuit connectivity, function and dysfunction. We used a bacterial artificial chromosome (BAC) transgenic strategy to express the H134R variant of channelrhodopsin-2, ChR2(H134R), under the control of cell type–specific promoter elements. We performed an extensive functional characterization of the newly established VGAT-ChR2(H134R)-EYFP, ChAT-ChR2(H134R)-EYFP, Tph2-ChR2(H134R)-EYFP and Pvalb(H134R)-ChR2-EYFP BAC transgenic mouse lines and demonstrate the utility of these lines for precisely controlling action-potential firing of GABAergic, cholinergic, serotonergic and parvalbumin-expressing neuron subsets using blue light. This resource of cell type–specific ChR2(H134R) mouse lines will facilitate the precise mapping of neuronal connectivity and the dissection of the neural basis of behavior.


Figures

Figure 1
Figure 1
Functional characterization of VGAT-ChR2(H134R)-EYFP BAC transgenic mice. (a) Diagram of acute coronal brain slice preparation containing the cortex and representative image showing placement of the optic fiber in the region of recorded cortical interneurons (asterisk) (top). Scale bar: 200 μm. High magnification IR-DIC and EYFP fluorescence image of a layer V interneuron (bottom). Scale bar: 20 μm. (b) Voltage clamp recording demonstrating photocurrents induced by blue laser light (26.3 mW mm−2) (top). Plot of peak steady-state photocurrent in response to blue light delivered as indicated (bottom). (c) Current clamp mode recording showing firing of a single neuron in response to blue light or to +400 pA current injection (top), or to prolonged 20 Hz stimulation (0.52 mW mm−2, 1 ms pulse width) (bottom). (d) Current clamp mode recording demonstrating action potential firing in response to patterned blue laser light stimulation (2.1 mW mm−2, 1 ms pulse width) (top and middle). An expanded view of initial action potential firing at 20 Hz demonstrating extra spikes (asterisks) is shown (bottom). (e) Reliable action potential firing of the same interneuron to patterned blue laser light stimulation at 50 Hz (top) and 80 Hz (middle). Expanded view of firing at 80 Hz is shown (bottom). (f) Diagram of recording configuration to test functional effect of light-induced interneuron firing in cortical microcircuits (top). Current clamp mode recording of a layer V pyramidal neuron showing hyperpolarization in response to 5 Hz blue laser stimulation (2.1 mW mm−2, 1 ms) (bottom). (g) Robust silencing of layer V pyramidal neuron firing in response to constant blue light (top) or 50 Hz blue laser stimulation (473 nm, 2.1 mW mm−2, 1 ms pulse width) (bottom). Action potential firing was induced by constant +150 pA direct current injection. (h) Voltage clamp recording of the same layer V pyramidal neuron in the absence (no drug) and presence of the indicated compounds. The blue bar indicates 50 Hz blue laser stimulation. (i) Response of the same neuron to 50 Hz blue laser light (2.1 mW mm−2, 1 ms pulse width) for 1 s (top) or 10 s (bottom) during co-application of GABA-A and GABA-B receptor antagonists.
Figure 2
Figure 2
Functional characterization of hippocampal interneurons in VGAT-ChR2(H134R)-EYFP BAC transgenic mice. (a) Diagram of acute coronal brain slice preparation containing the hippocampus and representative image showing placement of the optic fiber in the region of a recorded hippocampal interneuron (asterisk) (top). Scale bar: 200 μm. High magnification IRDIC and fluorescence image of an interneuron in the dentate gyrus molecular layer (bottom). Scale bar: 20 μm. (b) Example photocurrents induced by blue laser light (26.3 mW mm−2) in various hippocampal regions. (c) Plot of peak steady-state photocurrent in response to blue light for interneurons in various hippocampal regions. (d) Cell-attached recording of a dentate gyrus interneuron demonstrating firing in response to 10 s blue light stimulation (top). An expanded view is shown (bottom). (e, f) Current clamp mode (e) and voltage clamp (f) recording of a dentate gyrus interneuron in response to patterned blue laser stimulation as indicated (2.1 mW mm−2, 1 ms pulse width). (g, h) Current clamp mode (g) and voltage clamp (h) recording of a CA1 interneuron showing the response to patterned blue laser stimulation at 10, 20 and 50 Hz (2.1 mW mm−2, 1 ms pulse width). (i) Current clamp mode recording of a CA3 interneuron showing sustained action potential firing in response to repeated bouts of constant blue light. (j) Diagram of recording configuration to test functional effect of light-induced interneuron firing in the CA3c subfield circuitry (left) and voltage clamp recording of a CA3c pyramidal neuron demonstrating outward current in response to blue light (right).
Figure 3
Figure 3
Functional characterization of ChAT-ChR2(H134R)-EYFP line 6 BAC transgenic mice. (a) Diagram of acute coronal brain slice containing the dorsal striatum and a representative image showing placement of the optic fiber in the region of a recorded neuron (top). Scale bar: 200 μm. IR-DIC and EYFP fluorescence image of a recorded striatal cholinergic neuron (bottom). Scale bar: 20 μm. (b) Voltage clamp recording demonstrating inward current induced by blue laser light (26.3 mW mm−2) (top). Summary plot of peak steady-state photocurrent in response to blue light delivered as indicated (bottom). (c) Action potential firing in response to patterned blue laser light (5.21 mW mm−2, 5 ms pulse width). Asterisks indicate extra spikes. A small hyperpolarizing current injection was applied to silence basal firing. (d) Cell-attached recording of firing in response to patterned blue laser light (2.1 mW mm−2, 5 ms pulse width). Light stimuli were delivered on top of basal tonic firing.
Figure 4
Figure 4
In vivo straital electrophysiology for ChAT-ChR2-EYFP line 6 BAC transgenic mice. (a) Raster (top) and spike-density histograms (bottom) of a striatal cholinergic neuron in response to a single pulse of blue laser light (10 mW, 18 ms pulse width, blue arrow) over repeated trials. (b) Spike-density histogram of a striatal cholinergic neuron in response to 40 s blue laser light stimulation (10 mW, 18 ms pulse width) at 30 Hz frequency. (c) Spike-density histogram of a striatal cholinergic neuron showing rapid response (1–2 ms) to blue laser light stimulation (10 mW, 18 ms pulse width, blue arrow). (d) Bar graph of putative medium spiny neuron firing rate in response to 40 s blue laser light stimulation (10 mW, 18 ms pulse width) at 30 Hz (n = 20, P < 0.01).
Figure 5
Figure 5
Functional characterization of TPH2-ChR2(H134R)-EYFP BAC transgenic mice. (a) Diagram of acute coronal brainstem slice preparation and representative image showing placement of the optic fiber in the region of a recorded neuron (top). Scale bar: 200 μm. IR-DIC and EYFP fluorescence image of a recorded 5-HT neuron in the dorsal raphe nucleus (bottom). Scale bar: 20 μm. (b) Voltage clamp recording of a 5-HT neuron demonstrating inward current induced by blue laser light (26.3 mW mm−2) (top). Plot of peak steady-state photocurrent in response to blue light delivered as indicated (bottom). (c) Current clamp mode recording showing action potential firing in response to blue laser light (26.3 mW mm−2) (top) or in response to +100 pA current injection (bottom). (d–e) Current clamp mode (d) and voltage clamp (e) recording of responses to patterned blue laser light (26.3 mW mm−2, 5 ms pulse width). Asterisks indicate missed action potentials. Note: in panels c–d a small hyperpolarizing current injection was applied to silence basal firing. (f, g) Cell-attached recording of a 5-HT neuron under prolonged constant blue light stimulation (f) or to repeated bouts of blue light (g). (h) Summary plot of baseline and blue light-induced firing rates. ** P < 0.01 (one-tailed paired t-test).
Figure 6
Figure 6
Functional characterization of Pvalb-ChR2(H134R)-EYFP BAC transgenic mice. (a–e) Characterization of ChR2-EYFP positive neurons in the thalamic reticular nucleus (TRN). (a) Diagram of a coronal brain slice containing the TRN and representative image showing placement of the optic fiber (top) and EYFP fluorescence (bottom) in the region of recorded neurons. Scale bar: 200 μm. (b) Extracellular field recordings of a putative single TRN neuron that was silent at rest in response to blue laser light at 10.5 mW mm−2 (top) and 26.3 mW mm−2 (middle), or delivered from a mercury arc lamp (bottom). (c) Extracellular field recording of action potential firing in response to patterned blue laser light (26.3 mW mm−2, 5 ms pulse width). Asterisks indicate initial burst firing. (d) Expanded view of lower panel in c. (e–k) Characterization of ChR2-EYFP expressing cerebellar Purkinje cells. (e) Diagram of an acute brain slice containing the cerebellum and representative slice image showing placement of the optic fiber in the region of a recorded neuron in the Purkinje cell layer (top). Scale bar: 200 μm. IR-DIC image and EYFP fluorescence image of a recorded Purkinje cell (bottom). EYFP fluorescence was not easily detected in the Purkinje cell somata due to saturating EYFP fluorescence of the Purkinje cell dendrites in the adjacent molecular layer. Scale bar: 20 μm. (f) Voltage clamp recording demonstrating inward current induced by blue laser light (26.3 mW mm−2) (top). Summary plot of peak steady-state photocurrent in response to blue light delivered as indicated. (bottom). (g) Cell-attached recordings demonstrating potentiation of baseline firing in response to blue laser light at 1.05 mW mm−2 (top), 26.3 mW mm−2 (middle), and 157.9 mW mm−2 (bottom). (h) Current clamp mode recording showing firing in response to blue light (top) or to +400 pA current injection (bottom). (i,j) Voltage clamp (i) and current clamp mode (j) recording demonstrating responses to patterned blue laser light (26.3 mW mm−2, 5 ms pulse width). Asterisks indicate initial doublet firing. Note: a small hyperpolarizing current injection was applied to silence basal firing. (k) Cell-attached recording of action potential firing from a single neuron in response to patterned blue laser light (26.3 mW mm−2, 5 ms pulse width). Asterisks indicate doublet firing. This recorded Purkinje cell was silent at rest.

Similar articles

Cited by

References

    1. Gradinaru V, et al. Targeting and readout strategies for fast optical neural control in vitro and in vivo. J Neurosci. 2007;27:14231–14238. - PMC - PubMed
    1. Huber D, et al. Sparse optical microstimulation in barrel cortex drives learned behaviour in freely moving mice. Nature. 2008;451:61–64. - PMC - PubMed
    1. Johansen JP, et al. Optical activation of lateral amygdala pyramidal cells instructs associative fear learning. Proc Natl Acad Sci U S A. 2010;107:12692–12697. - PMC - PubMed
    1. Adamantidis AR, Zhang F, Aravanis AM, Deisseroth K, de Lecea L. Neural substrates of awakening probed with optogenetic control of hypocretin neurons. Nature. 2007;450:420–424. - PMC - PubMed
    1. Bi A, et al. Ectopic expression of a microbial-type rhodopsin restores visual responses in mice with photoreceptor degeneration. Neuron. 2006;50:23–33. - PMC - PubMed

Publication types

MeSH terms

Substances