

An actin-dependent mechanism for long-range vesicle transport
- PMID: 21983562
- PMCID: PMC3783939
- DOI: 10.1038/ncb2353
An actin-dependent mechanism for long-range vesicle transport
Abstract
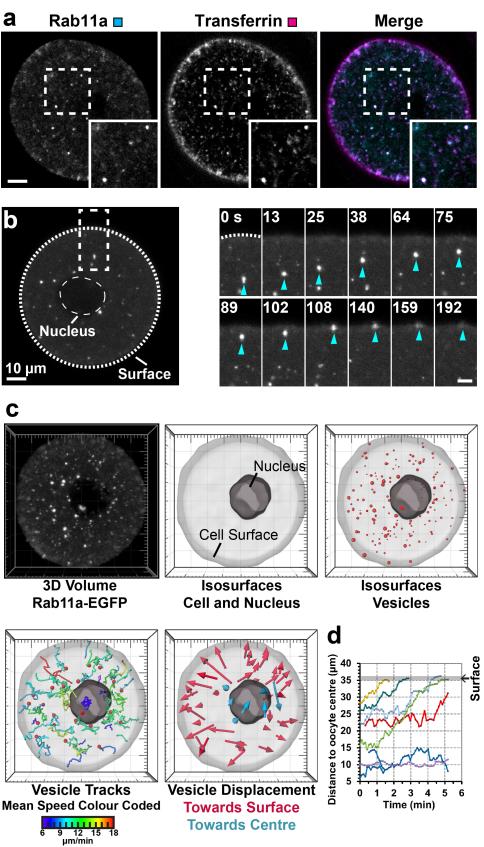
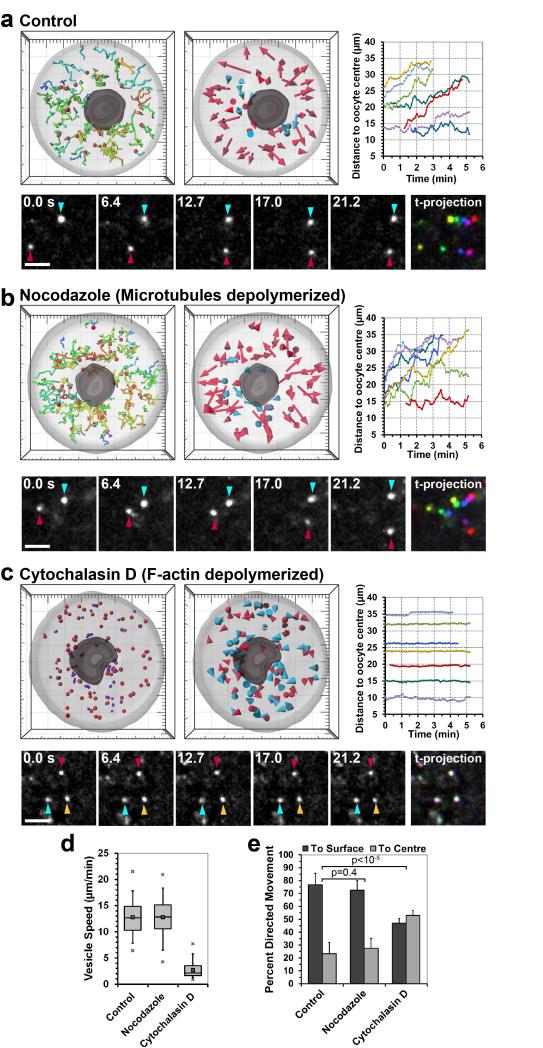
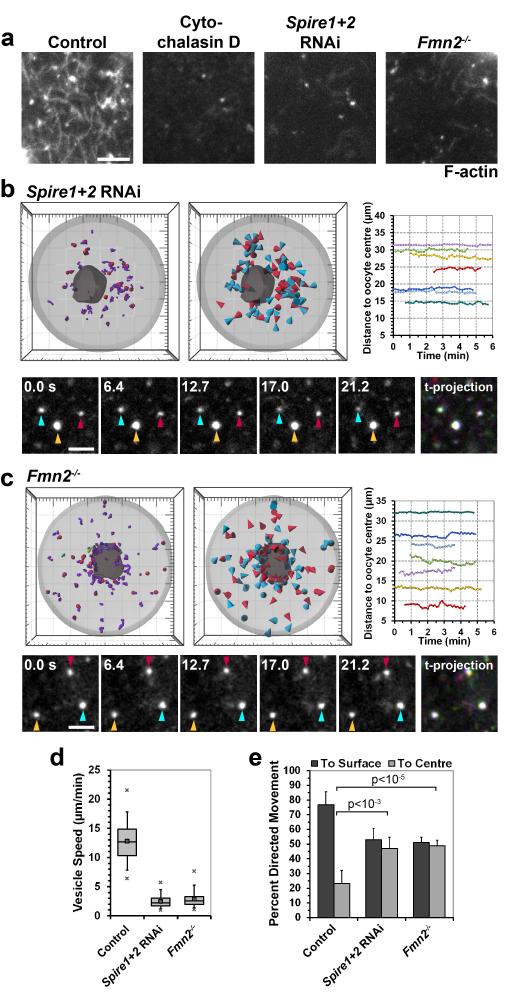
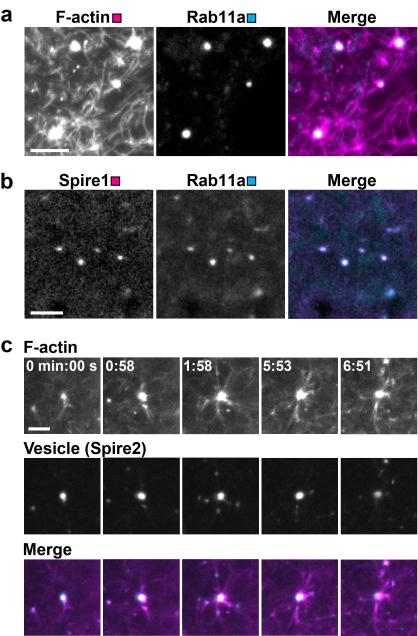
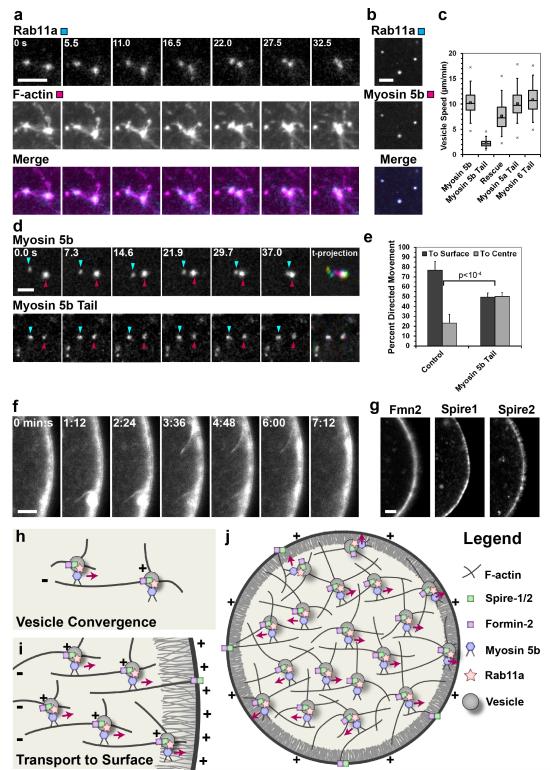
Intracellular transport is vital for the function, survival and architecture of every eukaryotic cell. Long-range transport in animal cells is thought to depend exclusively on microtubule tracks. This study reveals an unexpected actin-dependent but microtubule-independent mechanism for long-range transport of vesicles. Vesicles organize their own actin tracks by recruiting the actin nucleation factors Spire1, Spire2 and Formin-2, which assemble an extensive actin network from the vesicles' surfaces. The network connects the vesicles with one another and with the plasma membrane. Vesicles move directionally along these connections in a myosin-Vb-dependent manner to converge and to reach the cell surface. The overall outward-directed movement of the vesicle-actin network is driven by recruitment of vesicles to the plasma membrane in the periphery of the oocyte. Being organized in a dynamic vesicle-actin network allows vesicles to move in a local random manner and a global directed manner at the same time: they can reach any position in the cytoplasm, but also move directionally to the cell surface as a collective. Thus, collective movement within a network is a powerful and flexible mode of vesicle transport.
Figures
Comment in
-
Pulling together and pulling apart: collective cargo movement in eukaryotic cells.Nat Cell Biol. 2011 Dec 1;13(12):1391-2. doi: 10.1038/ncb2393. Nat Cell Biol. 2011. PMID: 22134759
Similar articles
-
Spire-type actin nucleators cooperate with Formin-2 to drive asymmetric oocyte division.Curr Biol. 2011 Jun 7;21(11):955-60. doi: 10.1016/j.cub.2011.04.029. Epub 2011 May 27. Curr Biol. 2011. PMID: 21620703 Free PMC article.
-
Pulling together and pulling apart: collective cargo movement in eukaryotic cells.Nat Cell Biol. 2011 Dec 1;13(12):1391-2. doi: 10.1038/ncb2393. Nat Cell Biol. 2011. PMID: 22134759
-
Vesicles modulate an actin network for asymmetric spindle positioning.Nat Cell Biol. 2013 Aug;15(8):937-47. doi: 10.1038/ncb2802. Epub 2013 Jul 21. Nat Cell Biol. 2013. PMID: 23873150 Free PMC article.
-
The role of SPIRE actin nucleators in cellular transport processes.J Cell Sci. 2023 Mar 15;136(6):jcs260743. doi: 10.1242/jcs.260743. Epub 2023 Mar 30. J Cell Sci. 2023. PMID: 36994763 Review.
-
Structural and functional insights into the Spir/formin actin nucleator complex.Biol Chem. 2013 Dec;394(12):1649-60. doi: 10.1515/hsz-2013-0176. Biol Chem. 2013. PMID: 23863697 Review.
Cited by
-
Ebola Virus Nucleocapsid-Like Structures Utilize Arp2/3 Signaling for Intracellular Long-Distance Transport.Cells. 2020 Jul 19;9(7):1728. doi: 10.3390/cells9071728. Cells. 2020. PMID: 32707734 Free PMC article.
-
Roles of actin binding proteins in mammalian oocyte maturation and beyond.Cell Cycle. 2016 Jul 17;15(14):1830-43. doi: 10.1080/15384101.2016.1181239. Epub 2016 May 6. Cell Cycle. 2016. PMID: 27152960 Free PMC article. Review.
-
Nucleus to Synapse Nesprin1 Railroad Tracks Direct Synapse Maturation through RNA Localization.Neuron. 2015 May 20;86(4):1015-1028. doi: 10.1016/j.neuron.2015.04.006. Epub 2015 May 7. Neuron. 2015. PMID: 25959729 Free PMC article.
-
Rab GTPases are required for early orientation of the left-right axis in Xenopus.Mech Dev. 2013 Apr-May;130(4-5):254-71. doi: 10.1016/j.mod.2012.11.007. Epub 2013 Jan 23. Mech Dev. 2013. PMID: 23354119 Free PMC article.
-
Synaptic vesicle traffic is supported by transient actin filaments and regulated by PKA and NO.Nat Commun. 2020 Oct 21;11(1):5318. doi: 10.1038/s41467-020-19120-1. Nat Commun. 2020. PMID: 33087709 Free PMC article.
References
-
- Alberts B, et al. Molecular Biology of the Cell. Fifth edn 2008.
-
- Lodish H, et al. Molecular Cell Biology (Lodish, Molecular Cell Biology) W. H. Freeman; 2007.
-
- Pollard T, Earnshaw W. Cell Biology. (Saunders. 2004
-
- Hirokawa N, Noda Y, Tanaka Y, Niwa S. Kinesin superfamily motor proteins and intracellular transport. Nat Rev Mol Cell Biol. 2009;10:682–696. doi:10.1038/nrm2774. - PubMed
Publication types
MeSH terms
Substances
Grants and funding
LinkOut - more resources
Full Text Sources
Other Literature Sources
Molecular Biology Databases
