. 2011 Oct 5;14(4):453-65.
doi: 10.1016/j.cmet.2011.08.009.

Distinct hypothalamic neurons mediate estrogenic effects on energy homeostasis and reproduction

Affiliations

Distinct hypothalamic neurons mediate estrogenic effects on energy homeostasis and reproduction

Yong Xu et al. Cell Metab. .

Erratum in

Abstract

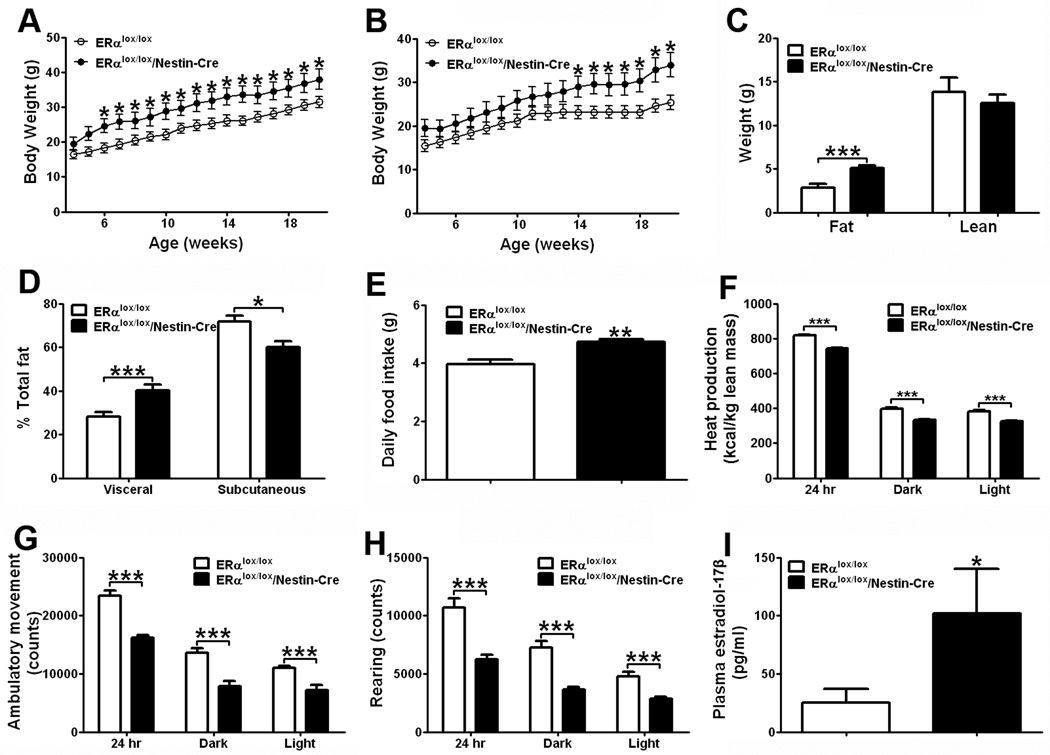
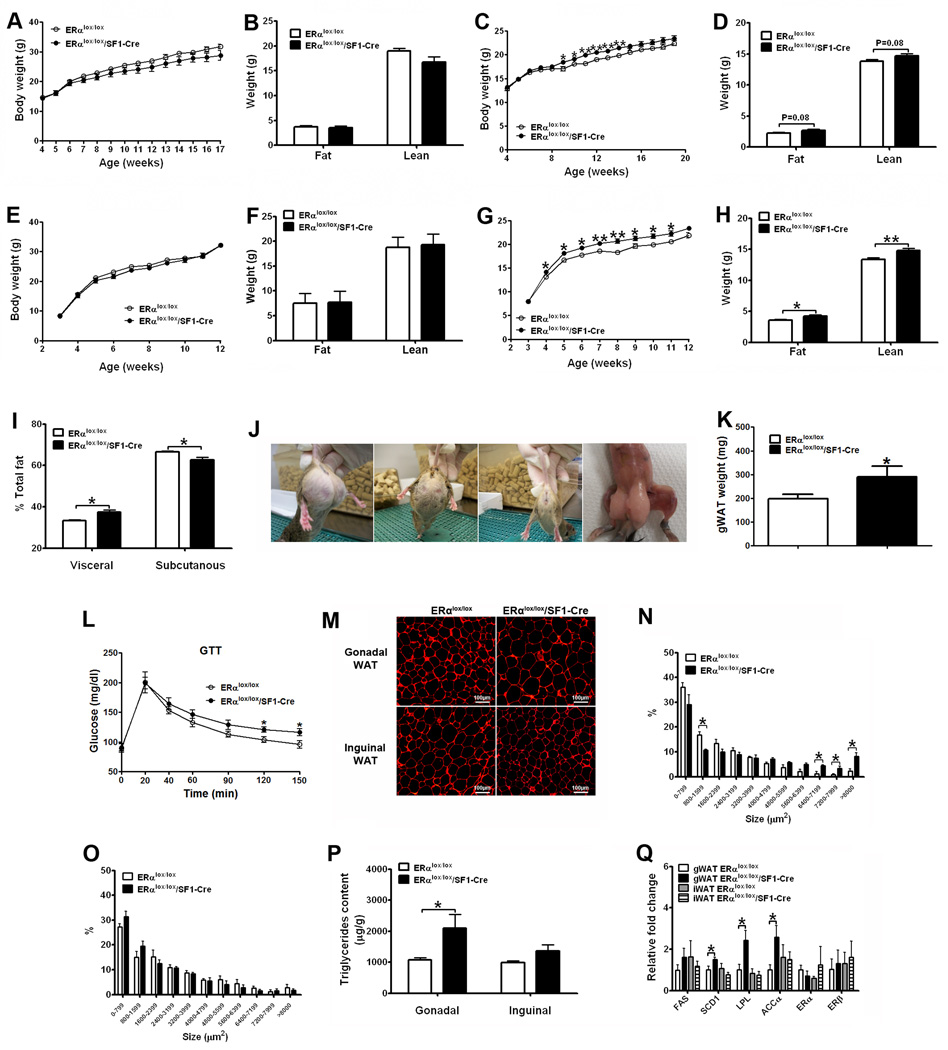
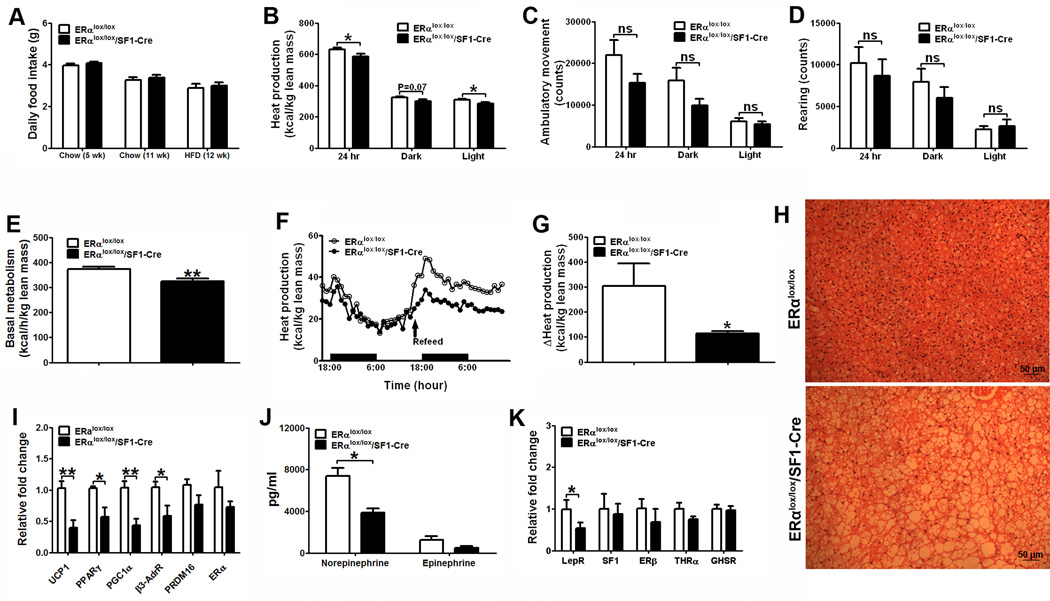
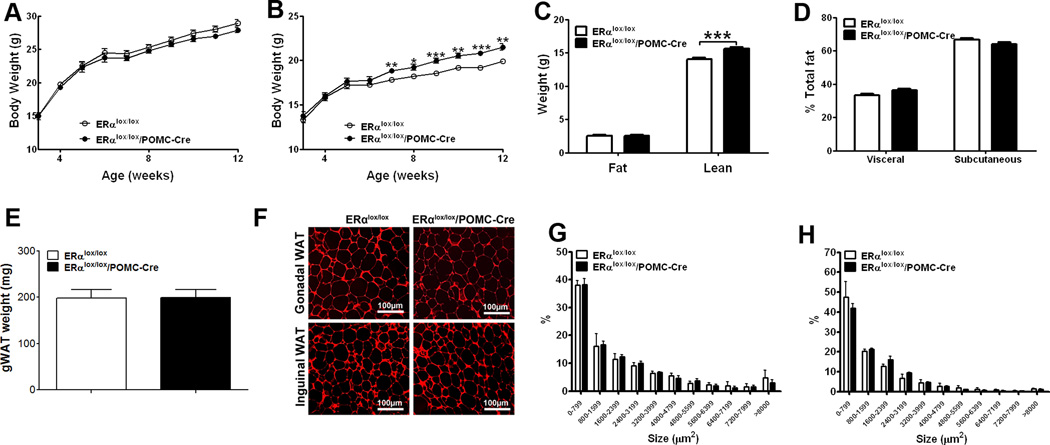
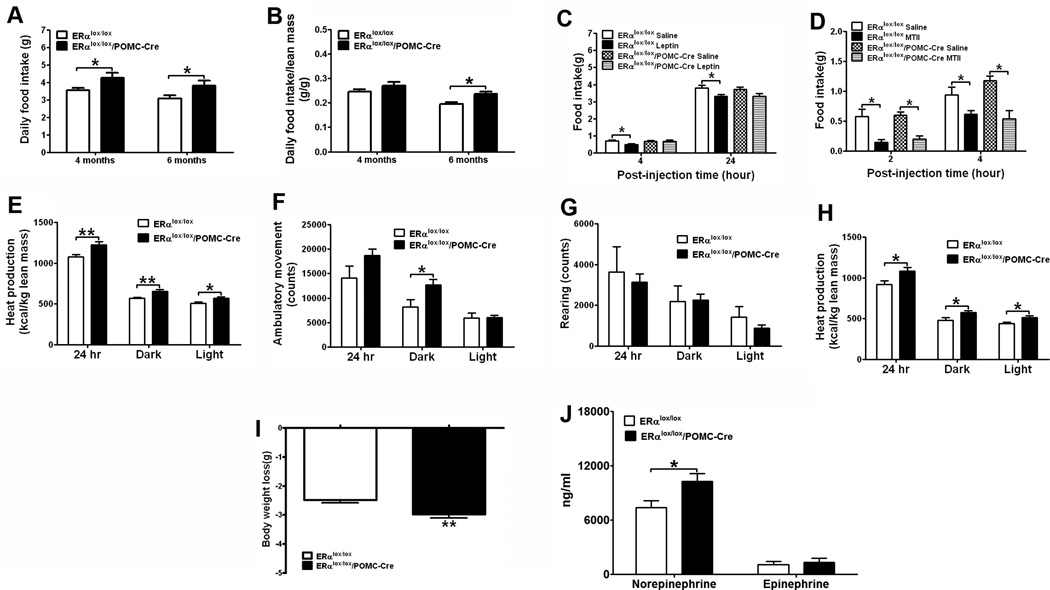
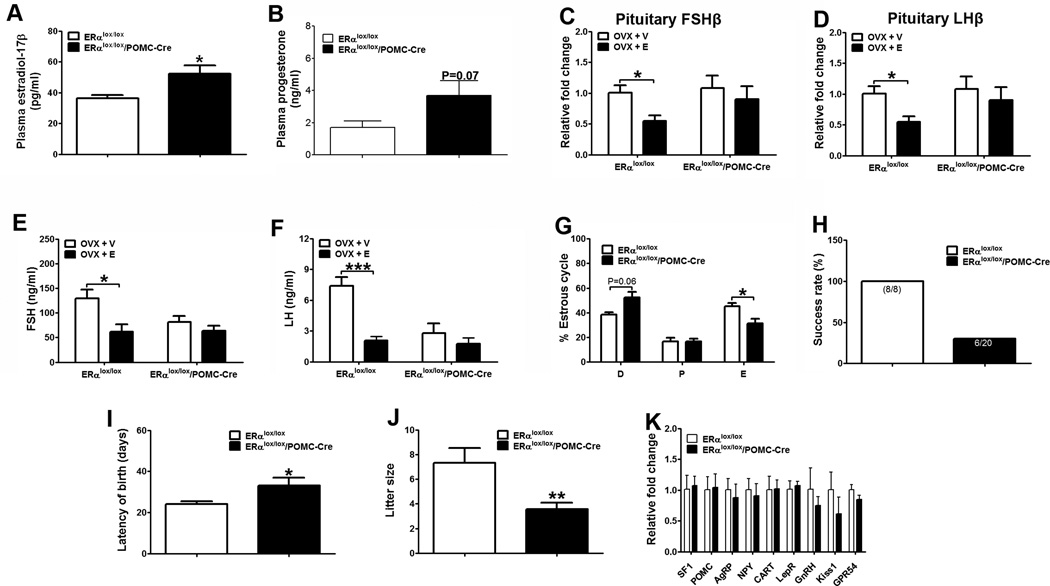
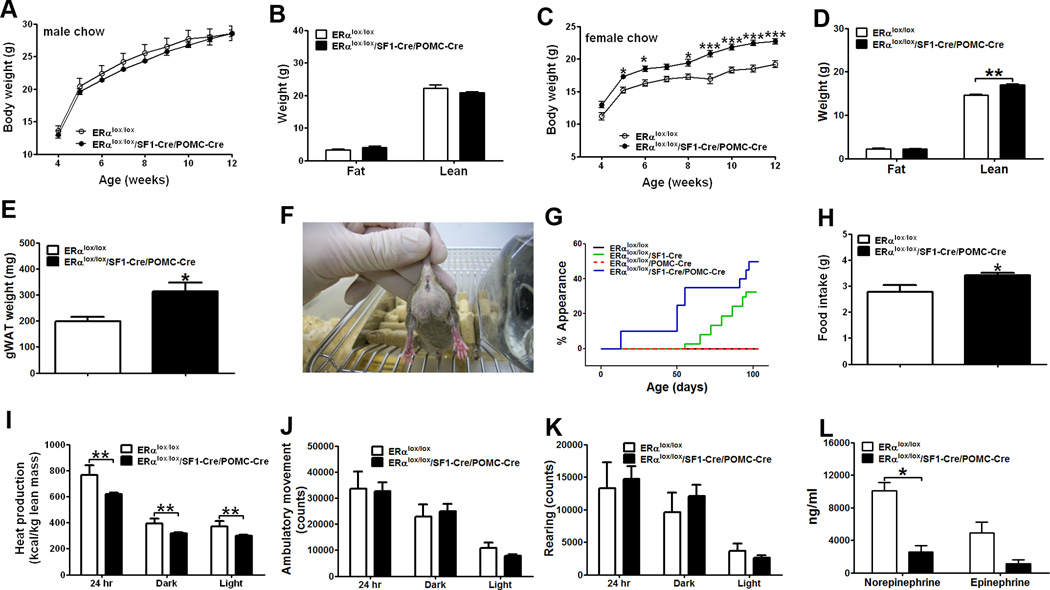
Estrogens regulate body weight and reproduction primarily through actions on estrogen receptor-α (ERα). However, ERα-expressing cells mediating these effects are not identified. We demonstrate that brain-specific deletion of ERα in female mice causes abdominal obesity stemming from both hyperphagia and hypometabolism. Hypometabolism and abdominal obesity, but not hyperphagia, are recapitulated in female mice lacking ERα in hypothalamic steroidogenic factor-1 (SF1) neurons. In contrast, deletion of ERα in hypothalamic pro-opiomelanocortin (POMC) neurons leads to hyperphagia, without directly influencing energy expenditure or fat distribution. Further, simultaneous deletion of ERα from both SF1 and POMC neurons causes hypometabolism, hyperphagia, and increased visceral adiposity. Additionally, female mice lacking ERα in SF1 neurons develop anovulation and infertility, while POMC-specific deletion of ERα inhibits negative feedback regulation of estrogens and impairs fertility in females. These results indicate that estrogens act on distinct hypothalamic ERα neurons to regulate different aspects of energy homeostasis and reproduction.


Figures

Figure 1
Figure 1
CNS ERα regulates energy homeostasis. (A) Weekly body weight in male mice weaned on regular chow (n=8/genotype). (B) Weekly body weight in female mice weaned on regular chow (n=8/genotype). (C) Body composition in 15-week old female mice fed with regular chow (n=8/genotype). (D) Relative fat distribution in the visceral and subcutaneous depots in 7-week old female mice fed with regular chow (n=8 or 10/genotype). (E) Daily food intake in 7-week old female mice fed with regular chow (n=8 or10/genotype). (F–H) Chow-fed female mice (n=8 or 10/genotype) were acclimated to the TSE metabolic chambers. Average heat production (F), ambulatory movements (G) and rearing activities (H) during 24 hr, 12 hr dark cycle and 12 hr light cycle. Note: mice used in (F–H) were 12-week old littermates, and had comparable body weight (ERαlox/lox: 22.8±1.5 vs ERαlox/lox/Nestin-Cre: 27.2±2.5, P>0.05) and lean mass (ERαlox/lox: 13.80±1.72 vs ERαlox/lox/Nestin-Cre: 12.50±0.98, P>0.05), but different fat mass (ERαlox/lox: 2.80±0.45 vs ERαlox/lox/Nestin-Cre: 5.10±0.27, P<0.001). (I) Plasma estradiol-17β at diestrus in 7-week old female mice fed with regular chow (n=8 or 10/genotype). Note: mice used in (D), (E) and (I) had different total fat mass (ERαlox/lox: 3.53±0.48 vs ERαlox/lox/Nestin-Cre: 6.01±1.67, P<0.05), but comparable lean mass (ERαlox/lox: 13.51±0.21 vs ERαlox/lox/Nestin-Cre: 14.10±0.76 (P>0.05). Data are presented as mean ± SEM, and * P<0.05 and ***P<0.001 between ERαlox/lox/Nestin-Cre mice and ERαlox/lox mice.
Figure 2
Figure 2
ERα expressed by SF1 neurons regulates body weight and fat distribution. (A) Weekly body weight in male mice weaned on regular chow (n=6 or 12/genotype). (B) Body composition in 11-week old male mice fed with regular chow (n=6 or 12/genotype). (C) Weekly body weight in female mice weaned on regular chow (n=22 or 25/genotype). (D) Body composition in 11-week old female mice fed with regular chow (n=22 or 25/genotype). (E) Weekly body weight in male mice weaned on HFD (n=1 1 or 21/genotype). (F) Body composition in 12-week old male mice fed with HFD (n=11 or 21/genotype). (G) Weekly body weight in female mice weaned on HFD (n=10 or 15/genotype). (H) Body composition in 8-week old female mice fed with HFD (n=10 or 15/genotype). (I) Relative fat distribution in the visceral and subcutaneous depots in 8-week old female mice fed with HFD (n=5/genotype). (J) Photographs of two ERαlox/lox/SF1-Cre female mice (the first and second from the left) and one ERαlox/lox female (the third from the left); the photograph of the carcass of one ERαlox/lox/SF1-Cre female (the fourth from the left; note that the abdominal wall of the mouse was intact). (K) Weight of gonadal WAT in 6-week old female mice fed with regular chow (n=6 or 9/genotype). (L) Glucose tolerance test in 10-week chow-fed female mice (i.p. 1 g/kg glucose, n=8 or 11/genotype). (M) Representative photomicrographs of H&E staining of gonadal WAT and inguinal WAT from 16-week old HFD-fed females. (N–O) Cell size in gonadal WAT (N) and inguinal WAT (O) from 16-week old HFD-fed females (n=3 or 4/genotype). (Q) Messenger RNA levels in WAT from 16-week old HFD-fed females (n=6/genotype). Data are presented as mean ± SEM, and * P<0.05 and **P<0.01 between ERαlox/lox/SF1-Cre mice and ERαlox/lox mice.
Figure 3
Figure 3
ERα expressed by SF1 neurons regulates energy expenditure. (A) Daily food intake in 5-week old female mice fed wit regular chow (n=7 or 23/genotype), 11-week old female mice fed with regular chow (n=9/genotype) and in 12-week old female mice fed with HFDHFD (n=12/genotype). (B–E) Chow-fed female mice were acclimated to the TSE metabolic chambers (n=11 or 12/genotype). Average heat production (B), ambulatory movements (C), rearing activities (D) during 24 hr, 12 hr dark cycle and 12 hr light cycle, and basal metabolism (E). Note: mice used in (B–E) were 20-week old littermates, and had comparable body weight (ERαlox/lox: 20.26±0.47 vs ERαlox/lox/SF1-Cre: 21.31±0.53, P>0.05), fat mass (ERαlox/lox: 3.37±0.26 vs ERαlox/lox/SF1-Cre: 4.10±0.45, P>0.05), and lean mass (ERαlox/lox: 15.45±0.45 vs ERαlox/lox/SF1-Cre: 15.97±0.34, P>0.05). (F–G) HFD-fed female mice were acclimated to the TSE metabolic chambers. HFD was removed from the TSE metabolic chambers for 24 hrs, followed by re-feeding for 24 hrs. Temporal responses in heat production (F) of female mice during fasting and HFD-re-feeding were monitored. (G) Increases in heat production after HFD re-feeding were calculated by subtracting heat production during 24 hr fasting from heat production during 24 hr re-feeding. Note: mice used in (F–G) were 12-week old littermates, and had comparable body weight (ERαlox/lox: 20.75±0.39 vs ERαlox/lox/SF1-Cre: 21.05±0.65, P>0.05), but different fat mass (ERαlox/lox: 3.55±0.19 vs ERαlox/lox/SF1-Cre: 4.23±0.22, P<0.05) and lean mass (ERαlox/lox: 13.55±0.32 vs ERαlox/lox/SF1-Cre: 14.77±0.34, P<0.05). (H) Representative photomicrographs of H&E staining of BAT from 16-week old HFD-fed females. (I) Messenger RNA levels in BAT from 16-week old HFD-fed females (n=6/genotype). (J) Plasma norepinephrine and epinephrine in chow-fed females (n=6/genotype). (K) Messenger RNA levels in micro-dissected VMH from 16-week old HFD-fed females (n=6/genotype). Data are presented as mean ± SEM, and * P<0.05, **P<0.01 and *** P<0.001 between ERαlox/lox/SF1-Cre mice and ERαlox/lox mice.
Figure 4
Figure 4
Deletion of ERα in POMC neurons leads to increased body weight and lean mass. (A) Weekly body weight in male mice weaned on regular chow (n=33 or 34/genotype). (B) Weekly body weight in female mice weaned on regular chow (n=25 or 32/genotype). (C) Body composition in 11-week old female mice fed with regular chow (n=25 or 32/genotype). (D) Relative fat distribution in the visceral and subcutaneous depots in 18-week old female mice fed with regular chow (n=5/genotype). (E) Weight of gonadal WAT in 6-week old female mice fed with regular chow (n=8 or 9/genotype). (F) Representative photomicrographs of H&E staining of gonadal WAT and inguinal WAT from 5-month old chow-fed females. (G–H) Cell size in gonadal WAT (G) and inguinal WAT (h) from 5-month old chow-fed females (n=3/genotype). Data are presented as mean ± SEM, and * P<0.05, **P<0.01 and ***P<0.001 between ERαlox/lox/POMC-Cre mice and ERαlox/lox mice.
Figure 5
Figure 5
Deletion of ERα in POMC neurons leads to hyperphagic and hypermetabolic phenotypes. (A) Daily food intake in 4-month old and 6-month old female mice fed with regular chow (n=12 or 13/genotype). (B) The same food intake data in (A) presented as daily food intake normalized by lean mass. (C) Effects of i.p. injections of leptin (5 mg/kg) on food intake in 12-week old chow-fed female mice (n=8/group). (D) Effects of i.p. injections of MTII (1 mg/kg) on food intake in 16-week old chow-fed female mice (n=8/group). (E–I) HFD-fed female mice (n=10 or 13/genotype) were acclimated to the TSE metabolic chambers. Average heat production (E), ambulatory movements (F) and rearing activities (G) during 24 hr, 12 hr dark cycle and 12 hr light cycle were measured at fed condition. (H–I) HFD was removed from the TSE metabolic chambers for 24 hrs, and average heat production (H) during 24 hr, 12 hr dark cycle and 12 hr light cycle was measured at fasted condition. (I) Body weight loss induced by 24 hr fasting was measured. Note: mice used in (E–I) were 20-week old littermates, and had comparable body weight (ERαlox/lox: 25.14±1.16 vs ERαlox/lox/POMC-Cre: 25.12±0.95, P>0.05), fat mass (ERαlox/lox: 8.84±0.13 vs ERαlox/lox/POMC-Cre: 8.80±0.11, P>0.05) and lean mass (ERαlox/lox: 14.28±0.27 vs ERαlox/lox/POMC-Cre: 14.72±0.22, P>0.05). (J) Plasma norepinephrine and epinephrine in chow-fed females (n=6/genotype). Data are presented as mean ± SEM, and * P<0.05 and **P<0.01 between ERαlox/lox/POMC-Cre mice and ERαlox/lox mice.
Figure 6
Figure 6
Deletion of ERα in POMC neurons leads to fertility phenotypes. (A–B) Plasma estradiol-17β (A) and progesterone (B) at diestrus in 6-month old female mice fed with HFD (n=6 or 8/genotype). (C–D) Relative mRNA levels of FSHβ (C) or LHβ (D) in the pituitary measured 4 weeks after receiving ovriectomy plus estradiol-17β replacement (0.5 µg/day/mouse, OVX+E) or plus vehicle (OVX+V) (n=6/group). (E–F) Plasma FSH (E) or LH (F) measured in mice described in (C–D). (G) Length of diestrus, proestrus and estrus relative to the entire etrus cycles (n=8 or 17/genotype). (H) Percentage of mice that successfully delivered pups (n=8 or 20/genotype). (I) Averaged time period between mating day and birth day of pups (n=8 or 6/genotype). (J) Averaged litter size (n=8 or 6/genotype). Note: Only mice that successfully delivered pups in (H) were included in the analyses in (I and J). (K) Relative mRNA levels in the hypothalamus from 16-week old chow-fed females (n=6/genotype). Data are presented as mean ± SEM, and *P<0.05, **P<0.01, and ***P<0.001 between ERαlox/lox/POMC-Cre mice and ERαlox/lox mice.
Figure 7
Figure 7
Deletion of ERα in both SF1 and POMC neurons produces hyperphagia and decreased energy expenditure. (A) Weekly body weight in male mice weaned on regular chow (n=6 or 15/genotype). (B) Body composition in 12-week old male mice fed with regular chow (n=6 or 15/genotype). (C) Weekly body weight in female mice weaned on regular chow (n=11 or 39/genotype). (D) Body composition in 12-week old female mice fed with regular chow (n=11 or 39/genotype). (E) Weight of gonadal WAT in 6-week old female mice fed with regular chow (n=7 or 9/genotype). (F) Photograph of an ERαlox/lox/SF1-Cre/POMC-Cre female mouse at the age of 6 weeks. (G) Appearance rate of abdominal obesity (defined by obvious abnormal expansion of the lower abdominal obesity as demonstrated in (E)). (H) Daily food intake was measured in 6-week old female mice fed with regular chow (n=6 or 17/genotype). (I–K) Chow-fed female mice (n=6 or 17/genotype) were acclimated to the TSE metabolic chambers and average heat production (I), ambulatory movement (J) and rearing activity (K) during 24 hr, 12 hr dark cycle and 12 hr light cycle was measured. Note: mice used in (H–K) were 6-week old littermates, and had comparable body weight (ERαlox/lox: 16.63±1.01 vs ERαlox/lox/SF1-Cre/POMC-Cre: 18.09±0.51, P>0.05) and fat mass (ERαlox/lox: 2.15±0.37 vs ERαlox/lox/SF1-Cre/POMC-Cre: 1.88±0.26, P<0.01), but different lean mass (ERαlox/lox: 12.33±0.35 vs ERαlox/lox/SF1-Cre/POMC-Cre: 13.69±0.22, P<0.01). (L) Plasma norepinephrine and epinephrine in chow-fed females (n=4/genotype, 6 weeks of age). Data are presented as mean ± SEM, and * P<0.05, **P<0.01, and ***P<0.001 between ERαlox/lox/SF1-Cre/POMC-Cre mice and ERαlox/lox mice.

Comment in

Similar articles

Cited by

References

    1. Asarian L, Geary N. Estradiol enhances cholecystokinin-dependent lipid-induced satiation and activates estrogen receptor-alpha-expressing cells in the nucleus tractus solitarius of ovariectomized rats. Endocrinology. 2007;148:5656–5666. - PubMed
    1. Backholer K, Bowden M, Gamber K, Bjorbaek C, Iqbal J, Clarke IJ. Melanocortins mimic the effects of leptin to restore reproductive function in lean hypogonadotropic ewes. Neuroendocrinology. 2010;91:27–40. - PMC - PubMed
    1. Billeci AM, Paciaroni M, Caso V, Agnelli G. Hormone replacement therapy and stroke. Curr Vasc Pharmacol. 2008;6:112–123. - PubMed
    1. Carr MC. The emergence of the metabolic syndrome with menopause. J Clin Endocrinol Metab. 2003;88:2404–2411. - PubMed
    1. Castaneda TR, Jurgens H, Wiedmer P, Pfluger P, Diano S, Horvath TL, Tang-Christensen M, Tschop MH. Obesity and the neuroendocrine control of energy homeostasis: the role of spontaneous locomotor activity. J Nutr. 2005;135:1314–1319. - PubMed

Publication types

LinkOut - more resources