. 2011 Oct 7;44(1):51-61.
doi: 10.1016/j.molcel.2011.07.033.

Ecdysone- and NO-mediated gene regulation by competing EcR/Usp and E75A nuclear receptors during Drosophila development

Affiliations

Ecdysone- and NO-mediated gene regulation by competing EcR/Usp and E75A nuclear receptors during Drosophila development

Danika M Johnston et al. Mol Cell. .

Abstract

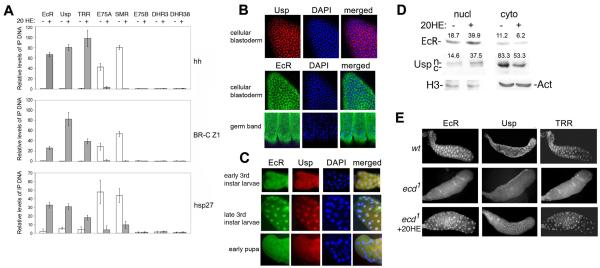
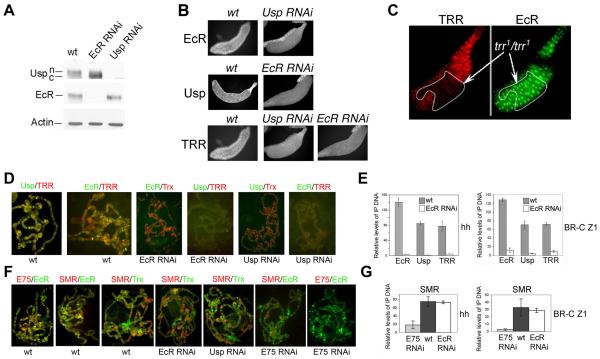
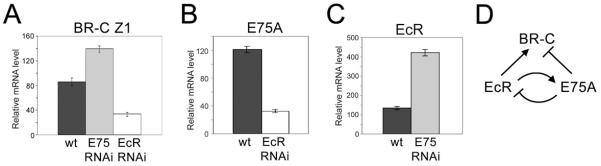
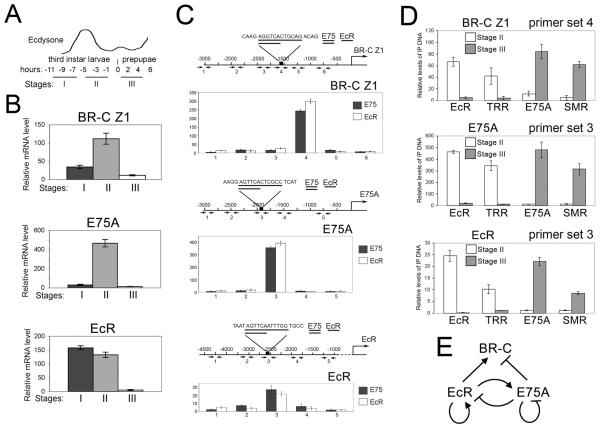
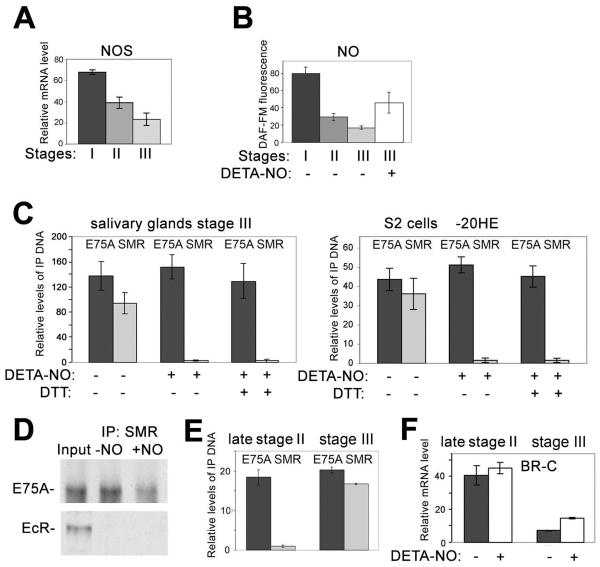
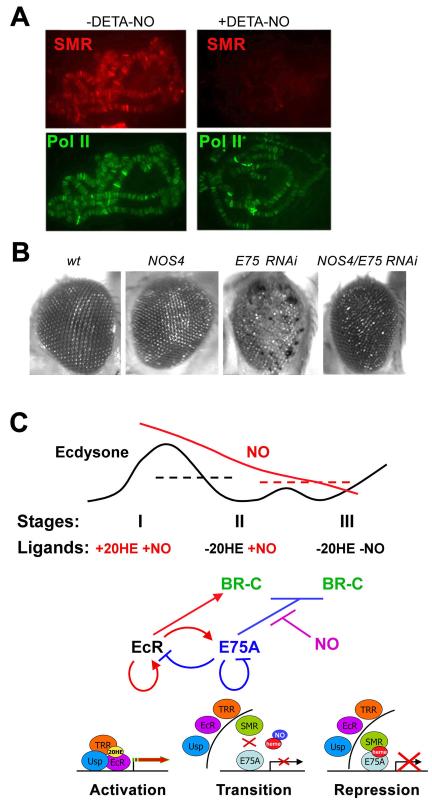
The Drosophila ecdysone receptor (EcR/Usp) is thought to activate or repress gene transcription depending on the presence or absence, respectively, of the hormone ecdysone. Unexpectedly, we found an alternative mechanism at work in salivary glands during the ecdysone-dependent transition from larvae to pupae. In the absense of ecdysone, both ecdysone receptor subunits localize to the cytoplasm, and the heme-binding nuclear receptor E75A replaces EcR/Usp at common target sequences in several genes. During the larval-pupal transition, a switch from gene activation by EcR/Usp to gene repression by E75A is triggered by a decrease in ecdysone concentration and by direct repression of the EcR gene by E75A. Additional control is provided by developmentally timed modulation of E75A activity by NO, which inhibits recruitment of the corepressor SMRTER. These results suggest a mechanism for sequential modulation of gene expression during development by competing nuclear receptors and their effector molecules, ecdysone and NO.


Figures

Figure 1
Figure 1. Ecdysone-dependent changes in association with target genes and subcellular distribution of ecdysone receptor components
(A) Relative amounts of EcR, Usp, TRR, E75A, SMR, E75B, DHR3, and DHR38 at the hh, BR-C Z1, and hsp27 promoters in S2 cells. Bars show means ± standard deviations above background from 3 ChIP experiments. Background was determined by omitting precipitating antibody. Primer set 4 (Fig. 4C) was used for BR-C Z1. (B, C) Immunostaining with EcR and Usp antibodies of cellular blastoderm and germ band-retracted embryos (B), and salivary glands from early (1 day old), late 3rd instar larvae and early pupae (stages II and III, respectively, Fig. 4A). (D) Western blots of EcR and Usp in extracts from nuclei and cytoplasm of S2 cells. Nuclear (n) and cytoplasmic (c) forms of Usp are indicated. Actin and histone H3 antibodies served as loading controls for cytoplasmic and nuclear extracts, respectively. Numbers in each column are the quantified band intensities, normalized to loading controls. The change in nuclear/cytoplasmic ratio with addition of 20HE is 3.88 for EcR and 4.02 for Usp. (E) Salivary glands of wild-type (wt) and homozygous ecd1 3rd instar larvae immunostained with Usp, EcR and TRR antibodies. Wild-type and ecd1 larvae were grown at 29° C, (restrictive temperature), starting at the end of the 2nd larval instar.
Figure 2
Figure 2. Interdependence among EcR, Usp and TRR for nuclear localization and binding to target genes
(A) Western blots of EcR and Usp in salivary gland lysates from wild-type (wt), Usp RNAi, and EcR RNAi 3rd instar larvae. Nuclear (n) and cytoplasmic (c) forms of Usp are indicated based on Fig. 1D. (B) Immunostaining of wt, Usp RNAi, and EcR RNAi 3rd instar salivary glands with Usp, EcR and TRR antibodies (as indicated). (C) Salivary glands dissected and double-immunostained with TRR (left) and EcR (right) antibodies. A trr1 null clone is outlined. (D) Polytene chromosomes from wt, EcR RNAi or Usp RNAi 3rd instar salivary glands (Stage II, Fig. 4A). Note that EcR, Usp, and TRR almost completely co-localize in wt, binding of the control Trx is not affected in either RNAi line, while binding of EcR, Usp and TRR are almost completely abolished in both. (E) Relative amounts of EcR, Usp and TRR detected by ChIP in the hh and BR-C Z1 upstream regions in wt and EcR RNAi. Bars show means ± standard deviations as in Fig. 1A. (F) Polytene chromosomes from wt or Usp, EcR or E75 RNAi as in D. Note that E75A, EcR and SMR co-localize at most sites in wt, SMR and the control Trx in EcR and Usp RNAi lines are similar to wt; SMR signal is significantly reduced in E75 RNAi, while EcR signal is comparable to wt. (G) Relative ChIP signals for SMR at hh and BR-C Z1 in E75 RNAi, wt, and EcR RNAi lines. Note that SMR in EcR RNAi is comparable to wt. Bars show means ± standard deviations as in Fig. 1A.
Figure 3
Figure 3. E75A is involved in repression of BR-C Z1 and EcR in larvae and prepupae
(A-C) Quantitative RT-PCR analysis of BR-C Z1 (A), E75A (B), EcR (C) mRNA in an equivalent mixture of salivary glands of 3rd instar larvae and prepupae from wild-type (wt, dark gray bars), E75 RNAi (light gray bars) and EcR RNAi lines (white bars). Rp49 is a non-target gene used to normalize results. Bars show means ± standard deviations from 3 experiments. (D) Schematic of cross-regulatory interactions between EcR and E75A based on the results in A-C.
Figure 4
Figure 4. Association of EcR and E75A complexes correlates with activation and repression of target genes, respectively
(A) Schematic of the larval-prepupal transition (adapted from (Huet et al., 1995). (B) Relative levels of BR-C Z1, E75A and EcR mRNA at stages I, II and III, from quantitative RT-PCR analysis of staged salivary glands, as in Fig. 3. (C) ChIP analysis of E75A and EcR in the BR-C Z1, E75A and EcR upstream regions of an equivalent mixture of salivary glands from stages II and III. Overlapping consensus binding sites for EcR and E75A in the upstream regions of BR-C Z1, E75A and EcR are shown in the maps above. Bars show means ± standard deviations. Note that the highest levels of both EcR and E75A are in the consensus binding site region. (D) ChIP analysis of binding to BR-C Z1, E75A and EcR by EcR and E75A complex components in staged larvae. Bars show means and standard deviations (3 experiments) of EcR, TRR, E75A and SMRTER (SMR) signals (above background) in stage II larvae and stage III prepupae. Background was determined by omitting precipitating antibody. PCR primer sets span the consensus binding sites in C: primer set 4 for BR-C Z1, primer sets 3 for E75A and EcR. (E) A scheme of cross-regulatory interactions between EcR and E75A.
Figure 5
Figure 5. A switch in binding from EcR to E75A at BR-C is triggered by falling levels of ecdysone and EcR
(A) ChIP analysis of EcR, SMRTER (SMR) and E75A at the consensus binding site region of BR-C Z1 in wild-type and EcR RNAi larvae at stage II. Bars show means ± standard deviations. (B) ChIP analysis of E75A, EcR and TRR at the consensus binding site region of BR-C Z1 in wild-type and EcR RNAi prepupae (stage III). Bars show means ± standard deviations. (C) Western blot analysis of EcR and E75A in staged larvae and prepupae. Actin served as a loading control. (D) Quantitative RT-PCR analysis of the relative levels of BR-C Z1 mRNA in stage III salivary glands from wild-type without (−) or with (+) added 20HE, or from wild-type (wt) or E75 RNAi lines, performed as in Fig. 3.
Figure 6
Figure 6. NO modulates the ability of E75A to repress BR-C
(A) Quantitative RT-PCR analysis of the relative levels of NO synthase (NOS) mRNA in salivary glands at stages I, II, and III, performed as in Fig. 3. (B) Relative levels of NO in salivary glands at stages I, II, and III, and III treated with DETA-NO (+), based on DAF-FM fluorescence. Bars show the averages (above background without DAF-FM) and standard deviations from at least 4 salivary glands for each stage. (C) ChIP analysis (as in Fig. 1A) of the association of E75A and SMRTER (SMR) with the BR-C Z1 consensus binding site region (Fig. 4C) in wild-type stage III salivary glands (left) and in S2 cells in the absence of ecdysone (−20HE) (right), without (−) or with (+) DETA-NO and DTT, as indicated. (D) Interaction of SMR with E75A and EcR in S2 cells grown in the absence of 20HE. Extract from S2 cells treated without (−NO) or with (+NO) DETA-NO was incubated with SMR antibody, and bound material was analyzed by western blotting with antibodies against E75A and EcR. Input, extract without IP. (E) ChIP analysis (as in Fig. 1A) of the association of E75A and SMR with the BR-C Z1 consensus binding site region (Fig. 4C) in wild-type late stage II or stage III salivary glands. (F) Quantitative RT-PCR analysis of the relative levels of BR-C Z1 mRNA in salivary glands at late stage II and stage III with (+) or without (−) incubation with DETA-NO, performed as in Fig. 3.
Figure 7
Figure 7. Inhibition of E75A repressive activity by NO may be a general feature of E75A function
(A) Detection of SMRTER (SMR), and the control RNA Pol II phosphorylated at Ser 5 (Pol II), on polytene chromosomes of wild-type larval salivary glands with (+) and without (−) incubation with DETA-NO. (B) Genetic interactions in the eye between NOS and E75. Mutant phenotypes were induced by the eye-specific GMR-driven expression of NOS4 and E75 RNAi. GMR-driven expression of E75 RNAi leads to a very strong rough eye phenotype with multiple necrotic areas. GMR-NOS4 rescues the E75 RNAi phenotype. Genotypes are (left to right): wt, GMR-GAL4/UAS-NOS4, GMR-GAL4/UAS-E75 RNAi, GMR-GAL4/UAS-NOS4/UAS-E75 RNAi. (C) Model for the roles of EcR and E75A complexes and their effector molecules during the larval-pupal transition. Larval-pupal stages and changes in concentrations of the effector molecules ecdysone and NO are shown at the top. Dotted lines indicate functional threshold levels for ecdysone (black) and NO (red). Middle and bottom diagrams show regulatory and molecular events, respectively, that accompany the transition from activation to repression of ecdysone-induced genes.

Similar articles

Cited by

References

    1. Arbeitman MN, Hogness DS. Molecular chaperones activate the Drosophila ecdysone receptor, an RXR heterodimer. Cell. 2000;101:67–77. - PubMed
    1. Ashburner M. Ecdysone induction of puffing in polytene chromosomes of Drosophila melanogaster. Effects of inhibitors of RNA synthesis. Exp Cell Res. 1972;71:433–440. - PubMed
    1. Baker KD, Shewchuk LM, Kozlova T, Makishima M, Hassell A, Wisely B, Caravella JA, Lambert MH, Reinking JL, Krause H, et al. The Drosophila orphan nuclear receptor DHR38 mediates an atypical ecdysteroid signaling pathway. Cell. 2003;113:731–742. - PubMed
    1. Buszczak M, Segraves WA. Insect metamorphosis: out with the old, in with the new. Curr Biol. 2000;10:R830–833. - PubMed
    1. Cao X, Liu W, Lin F, Li H, Kolluri SK, Lin B, Han YH, Dawson MI, Zhang XK. Retinoid X receptor regulates Nur77/TR3-dependent apoptosis [corrected] by modulating its nuclear export and mitochondrial targeting. Mol Cell Biol. 2004;24:9705–9725. - PMC - PubMed

Publication types

LinkOut - more resources