Development of an optimized backbone of FRET biosensors for kinases and GTPases
- PMID: 21976697
- PMCID: PMC3226481
- DOI: 10.1091/mbc.E11-01-0072
Development of an optimized backbone of FRET biosensors for kinases and GTPases
Abstract
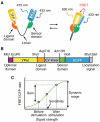
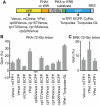
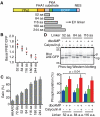
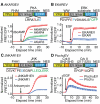
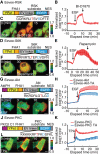
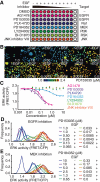
Biosensors based on the principle of Förster (or fluorescence) resonance energy transfer (FRET) have shed new light on the spatiotemporal dynamics of signaling molecules. Among them, intramolecular FRET biosensors have been increasingly used due to their high sensitivity and user-friendliness. Time-consuming optimizations by trial and error, however, obstructed the development of intramolecular FRET biosensors. Here we report an optimized backbone for rapid development of highly sensitive intramolecular FRET biosensors. The key concept is to exclude the "orientation-dependent" FRET and to render the biosensors completely "distance-dependent" with a long, flexible linker. We optimized a pair of fluorescent proteins for distance-dependent biosensors, and then developed a long, flexible linker ranging from 116 to 244 amino acids in length, which reduced the basal FRET signal and thereby increased the gain of the FRET biosensors. Computational simulations provided insight into the mechanisms by which this optimized system was the rational strategy for intramolecular FRET biosensors. With this backbone system, we improved previously reported FRET biosensors of PKA, ERK, JNK, EGFR/Abl, Ras, and Rac1. Furthermore, this backbone enabled us to develop novel FRET biosensors for several kinases of RSK, S6K, Akt, and PKC and to perform quantitative evaluation of kinase inhibitors in living cells.
Figures

Similar articles
-
Booster, a Red-Shifted Genetically Encoded Förster Resonance Energy Transfer (FRET) Biosensor Compatible with Cyan Fluorescent Protein/Yellow Fluorescent Protein-Based FRET Biosensors and Blue Light-Responsive Optogenetic Tools.ACS Sens. 2020 Mar 27;5(3):719-730. doi: 10.1021/acssensors.9b01941. Epub 2020 Feb 26. ACS Sens. 2020. PMID: 32101394
-
Imaging of Genetically Encoded FRET-Based Biosensors to Detect GPCR Activity.Methods Mol Biol. 2021;2268:159-178. doi: 10.1007/978-1-0716-1221-7_11. Methods Mol Biol. 2021. PMID: 34085268
-
Visualization of small GTPase activity with fluorescence resonance energy transfer-based biosensors.Nat Protoc. 2009;4(11):1623-31. doi: 10.1038/nprot.2009.175. Epub 2009 Oct 15. Nat Protoc. 2009. PMID: 19834477
-
Stable expression of FRET biosensors: a new light in cancer research.Cancer Sci. 2012 Apr;103(4):614-9. doi: 10.1111/j.1349-7006.2011.02196.x. Epub 2012 Feb 3. Cancer Sci. 2012. PMID: 22188216 Free PMC article. Review.
-
Protein biosensors based on the principle of fluorescence resonance energy transfer for monitoring cellular dynamics.Biotechnol Lett. 2006 Dec;28(24):1971-82. doi: 10.1007/s10529-006-9193-5. Epub 2006 Oct 5. Biotechnol Lett. 2006. PMID: 17021660 Review.
Cited by
-
Simultaneous quantitative live cell imaging of multiple FRET-based biosensors.PLoS One. 2013 Apr 16;8(4):e61096. doi: 10.1371/journal.pone.0061096. Print 2013. PLoS One. 2013. PMID: 23613792 Free PMC article.
-
Interplay between chemotaxis and contact inhibition of locomotion determines exploratory cell migration.Nat Commun. 2015 Apr 8;6:6619. doi: 10.1038/ncomms7619. Nat Commun. 2015. PMID: 25851023 Free PMC article.
-
Imaging the pharmacology of nanomaterials by intravital microscopy: Toward understanding their biological behavior.Adv Drug Deliv Rev. 2017 Apr;113:61-86. doi: 10.1016/j.addr.2016.05.023. Epub 2016 Jun 4. Adv Drug Deliv Rev. 2017. PMID: 27266447 Free PMC article. Review.
-
Erk regulation of actin capping and bundling by Eps8 promotes cortex tension and leader bleb-based migration.Elife. 2015 Jul 11;4:e08314. doi: 10.7554/eLife.08314. Elife. 2015. PMID: 26163656 Free PMC article.
-
Cellular Complexity in MAPK Signaling in Plants: Questions and Emerging Tools to Answer Them.Front Plant Sci. 2018 Nov 27;9:1674. doi: 10.3389/fpls.2018.01674. eCollection 2018. Front Plant Sci. 2018. PMID: 30538711 Free PMC article. Review.
References
-
- Allen MD, Zhang J. Subcellular dynamics of protein kinase A activity visualized by FRET-based reporters. Biochem Biophys Res Commun. 2006;348:716–721. - PubMed
-
- Aoki K, Matsuda M. Visualization of small GTPase activity with fluorescence resonance energy transfer-based biosensors. Nat Protoc. 2009;4:1623–1631. - PubMed
-
- Chiu VK, Bivona T, Hach A, Sajous JB, Silletti J, Wiener H, Johnson RL, 2nd, Cox AD, Philips MR. Ras signalling on the endoplasmic reticulum and the Golgi. Nat Cell Biol. 2002;4:343–350. - PubMed
Publication types
MeSH terms
Substances
LinkOut - more resources
Full Text Sources
Other Literature Sources
Research Materials
Miscellaneous

