Comparative Study
. 2011 Oct 5;31(40):14182-90.
doi: 10.1523/JNEUROSCI.6595-10.2011.

Levels of BDNF impact oligodendrocyte lineage cells following a cuprizone lesion

Affiliations
Comparative Study

Levels of BDNF impact oligodendrocyte lineage cells following a cuprizone lesion

Melissa W VonDran et al. J Neurosci. .

Abstract

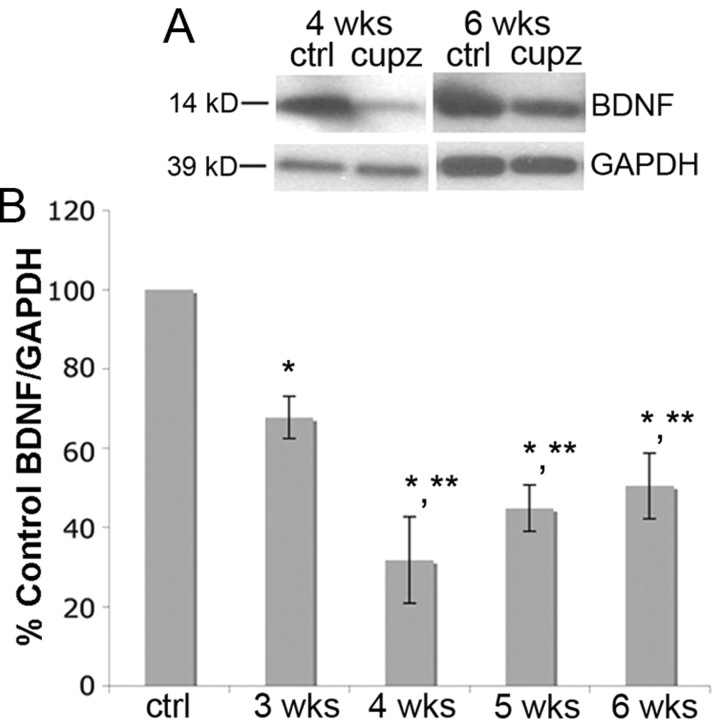
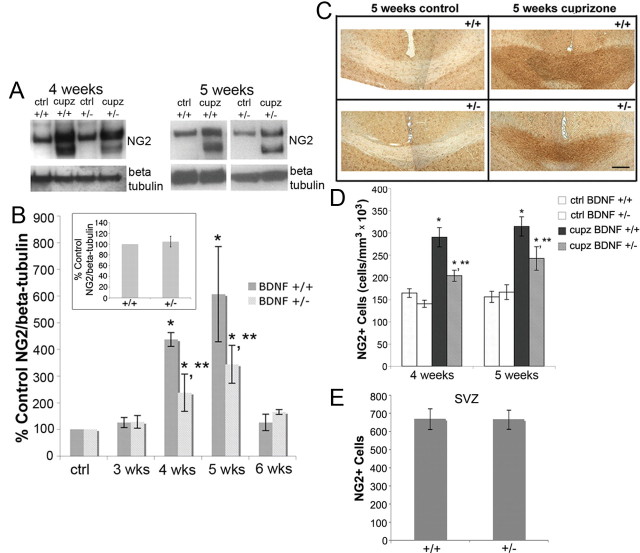
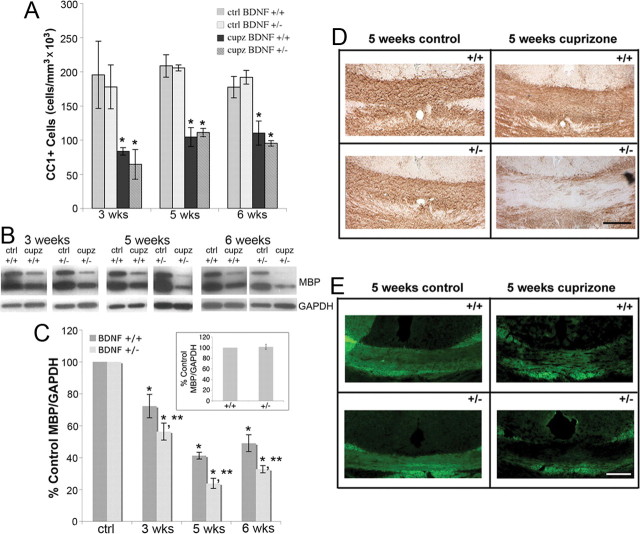
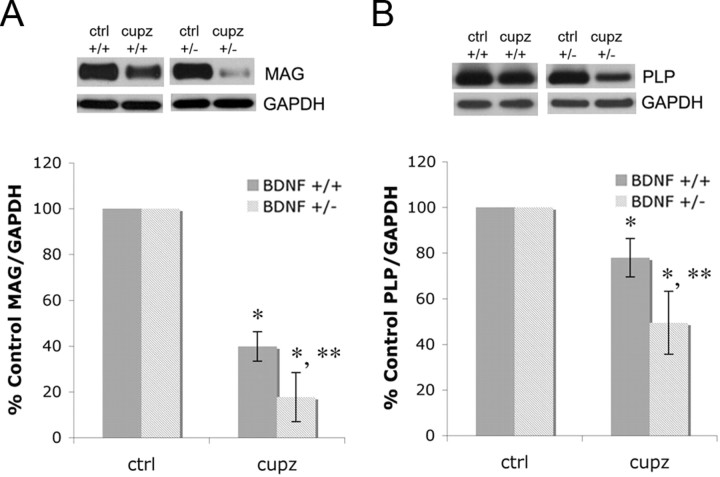
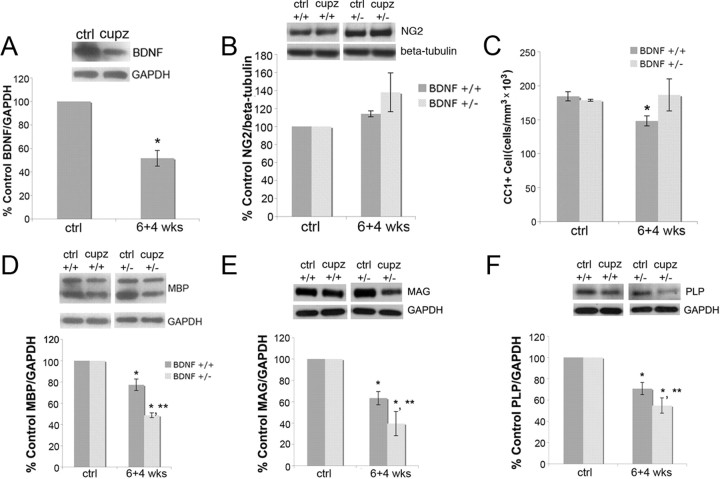
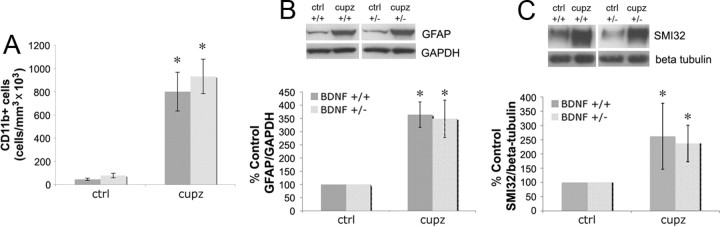
Previous work in culture has shown that basal forebrain (BF) oligodendrocyte (OLG) lineage cells respond to BDNF by increasing DNA synthesis and differentiation. Further, in the BF in vivo, reduced levels of BDNF as seen in BDNF(+/-) mice result in reduced numbers of NG2+ cells and deficits in myelin proteins throughout development and in the adult, suggesting that BDNF impacts the proliferating population of OLGs as well as differentiation in vivo. In this study, to investigate the roles BDNF may play in the repair of a demyelinating lesion, the cuprizone model was used and the corpus callosum was examined. BDNF protein levels were reduced after cuprizone treatment, suggesting that the demyelinating lesion itself elicits a decrease in BDNF. To analyze the effects of a further reduction of BDNF on OLG lineage cells following cuprizone, BDNF(+/-) mice were evaluated. These mice exhibited a blunted increase in the NG2 response at 4 and 5 weeks of cuprizone treatment. In addition, BDNF(+/-) mice exhibited decreased levels of myelin proteins during the demyelination and remyelination processes with no change in the total number of OLGs. These effects appear to be relatively specific to OLG lineage cells as comparable changes in CD11b+ microglia, GFAP+ astrocytes, and SMI32+ injured axons were not observed. These data indicate that BDNF may play a role following a demyelinating lesion by regulating the numbers of progenitors and the abilities of demyelinating and differentiating cells to express myelin proteins.


Figures

Figure 1.
Figure 1.
OLGs of the corpus callosum express full-length trkB. Immunohistochemistry shows that CC1+ cells (red) colocalize with trkB (green) in the adult corpus callosum of BDNF+/+ mice. The arrow shows a colocalized cell, and the arrowhead indicates a cell positive for only one antigen. Scale bar, 50 μm.
Figure 2.
Figure 2.
BDNF protein is reduced in the corpus callosum following cuprizone treatment. A, Western blots of mature BDNF (14 kDa) in control animals and in animals treated with cuprizone for 4 or 6 weeks. Anti-GAPDH was used to normalize to total protein levels. B, The graph represents densitometric analysis of the blots at 3, 4, 5, and 6 weeks of cuprizone treatment. Results are shown as percentage control BDNF/GAPDH. Data were analyzed by ANOVA. *Significant difference from control (no cuprizone) at p < 0.05; **significant difference from animals treated with cuprizone for 3 weeks, but not from other time points. (N = 4 for all time points).
Figure 3.
Figure 3.
BDNF+/− mice exhibit a blunted increase in NG2 progenitors following cuprizone treatment compared with BDNF+/+ mice. A, Western blots of NG2 in control animals and animals treated with cuprizone for 4 or 5 weeks. Anti-β-tubulin was used to normalize to total protein levels. B, The graph represents densitometric analysis of the blots at 3, 4, 5, and 6 weeks of cuprizone treatment. Each result (BDNF+/+ or BDNF+/−) is shown as a percentage of its own control (no cuprizone) NG2/β-tubulin for each time point. Data were analyzed by ANOVA. *Significant difference from control (no cuprizone) mice at p < 0.05; **significant difference from BDNF+/+ mice at p < 0.05 (N = 4 at 3 and 6 weeks for BDNF+/+ and BDNF+/− mice, and at 5 weeks for BDNF+/− mice; N = 3 at 4 weeks for BDNF+/+ and BDNF+/− mice, and at 5 weeks for BDNF+/+ mice). Inset represents densitometric analysis of NG2 blots of 8–12-week-old BDNF+/+ and BDNF+/− unlesioned corpus callosum. Data were analyzed by Student's t test (N = 7). C, Representative sections of NG2-stained BDNF+/+ and BDNF+/− corpus callosum following 5 weeks of control or cuprizone feeding. D, Coronal sections of the corpus callosum overlying the fornix of BDNF+/+ and BDNF+/− mice fed control feed or cuprizone for 4 or 5 weeks were stained with an antibody for NG2. Estimates for volumes and cell numbers were obtained by unbiased stereological morphometric analysis using the Bioquant Image Analyzer Program, version 6.90.10. Data were analyzed by ANOVA. *Significant difference from control (no cuprizone) mice at p < 0.05; **significant difference from BDNF+/+ mice at p < 0.05 (N = 3 for both time points). E, Coronal sections of the SVZ 1.10–0 mm from bregma of adult BDNF+/+ and BDNF+/− mice were stained with an antibody for NG2. Total numbers of NG2 cells per assessed SVZ area were counted in BDNF+/+ and BDNF+/− mice and analyzed using the Student's t test (N = 3).
Figure 4.
Figure 4.
CC1+ cell numbers are similarly reduced in the corpus callosum of BDNF+/+ and BDNF+/− mice following cuprizone treatment, while BDNF+/− mice exhibit a more severe decrease in MBP following cuprizone treatment than do BDNF+/+ mice. A, Coronal sections of the corpus callosum overlying the fornix of BDNF+/+ and BDNF+/− mice fed control feed or cuprizone for 3, 5, or 6 weeks were stained with an antibody for CC1. Estimates for volumes and cell numbers were obtained by unbiased stereological morphometric analysis using the Bioquant Image Analyzer Program, version 6.90.10. Data were analyzed by ANOVA. *Significant difference from control (no cuprizone) mice at p < 0.05 (N = 3 for all time points). B, Western blots of MBP in the corpus callosum of control animals and animals treated with cuprizone for 3, 5, and 6 weeks. Anti-GAPDH was used to normalize to total protein levels. C, The graph represents densitometric analysis of the blots at 3, 5, and 6 weeks of cuprizone treatment. Each result (BDNF+/+ or BDNF+/−) is shown as a percentage of its own control (no cuprizone) MBP/GAPDH for each time point. Data were analyzed by ANOVA. *Significant difference from control (no cuprizone) mice at p < 0.05; **significant difference from BDNF+/+ mice at p < 0.05 (N = 3 at 3 weeks for BDNF+/+ and BDNF+/− mice; N = 4 at all other time points). Inset represents densitometric analysis of MBP blots of 8–12-week-old BDNF+/+ and BDNF+/− unlesioned corpus callosum. Data were analyzed by Student's t test (N = 7). D, E, Sections from BDNF+/+ and BDNF+/− mice fed control feed or cuprizone for 5 weeks were stained with an antibody for MBP and visualized with DAB (D) or FluoroMyelin (E). Sections are coronal over the fornix.
Figure 5.
Figure 5.
BDNF+/− mice exhibit a more severe decrease in MAG and PLP following cuprizone treatment than do BDNF+/+ mice. A, B, Western blots of MAG (A) and PLP (B) in control animals and animals treated with cuprizone for 5 weeks in the corpus callosum. Anti-GAPDH was used to normalize to total protein levels. The graphs represent densitometric analysis of the blots of samples from animals treated with cuprizone for 5 weeks. Each result (BDNF+/+ or BDNF+/−) is shown as a percentage of its own control (no cuprizone) MAG/GAPDH or PLP/GAPDH. Data were analyzed by ANOVA. *Significant difference from control (no cuprizone) mice at p < 0.05; **significant difference from BDNF+/+ mice at p < 0.05 (N = 3).
Figure 6.
Figure 6.
Four weeks after cuprizone removal, BDNF remains reduced, and BDNF+/− mice exhibit a continued decrease of MBP, MAG, and PLP compared with BDNF+/+ mice, while the numbers of NG2 and CC1+ cells are equal to those of wild-type controls. A, BDNF protein is reduced in the corpus callosum during remyelination. Western blot is of mature BDNF (14 kDa) in control and 6 + 4 week cuprizone-treated animals. Anti-GAPDH was used to normalize to total protein levels. The graph represents densitometric analysis of the blots. Results are shown as a percentage of control BDNF/GAPDH. Data were analyzed by Student's t test. *Significant difference from control (no cuprizone) mice at p < 0.05 (N = 3). B, NG2 protein is unaffected in the corpus callosum during remyelination. Western blot evaluated NG2 in control and 6 + 4 week cuprizone-treated animals. β-Tubulin was used to normalize to total protein levels. The graph represents densitometric analysis of the blots. Results are shown as a percentage of control NG2/β-tubulin. Data were analyzed by ANOVA (N = 3). C, BDNF+/+ and BDNF+/− mice exhibit recovery of numbers of CC1+ OLGs after 6 + 4 weeks of cuprizone treatment. Coronal sections of the corpus callosum overlying the fornix of BDNF+/+ and BDNF+/− mice fed control feed or cuprizone for 6 + 4 weeks were stained with an antibody for CC1. Estimates for volumes and cell numbers were obtained by unbiased stereological morphometric. Data were analyzed by ANOVA. *Significant difference from control (no cuprizone) mice at p < 0.05 (N = 3). D–F, BDNF+/− mice exhibit a more severe decrease in MBP, MAG, and PLP following cuprizone treatment for 6 + 4 weeks than do BDNF+/+ mice. Anti-GAPDH was used to normalize to total protein. The graphs represent densitometric analysis of the blots. Results are shown as a percentage of control (no cuprizone) MBP/GAPDH, MAG/GAPDH, and PLP/GAPDH. Data were analyzed by ANOVA. *Significant difference from control (no cuprizone) mice at p < 0.05; **significant difference from BDNF+/+ mice at p < 0.05 (N = 3).
Figure 7.
Figure 7.
BDNF+/+ and BDNF+/− mice exhibit similar increases in CD11b+ cells, as well as GFAP and SMI32 protein following cuprizone treatment. A, Coronal sections of the corpus callosum overlying the fornix of BDNF+/+ and BDNF+/− mice fed control feed or cuprizone for 4 weeks were stained with an antibody for CD11b. Estimates for volumes and cell numbers were obtained by unbiased stereological morphometric analysis using the Bioquant Image Analyzer Program, version 6.90.10. Data were analyzed by ANOVA. *Significant difference from control (no cuprizone) mice at p < 0.05 (N = 3). B, Western blot evaluated GFAP in control animals and animals treated with cuprizone for 4 weeks. GAPDH was used to normalize to total protein levels. The graph represents densitometric analysis of the blots after 4 weeks of cuprizone treatment. Results (BDNF+/+ or BDNF+/− mice) are shown as a percentage of its own control (no cuprizone) GFAP/GAPDH. Data were analyzed by ANOVA. *Significant difference from control (no cuprizone) mice at p < 0.05 (N = 4 for BDNF+/+ mice and N = 3 for BDNF+/− mice). C, Western blot evaluated SMI32 in control animals and animals treated with cuprizone for 4 weeks. Anti-β tubulin was used to normalize to total protein levels. The graph represents densitometric analysis of the blots after 4 weeks of cuprizone treatment. Results (BDNF+/+ or BDNF+/− mice) are shown as a percentage of its own control (no cuprizone) SMI32/β tubulin. Data were analyzed by ANOVA. *Significant difference from control (no cuprizone) mice at p < 0.05 (N = 4 for BDNF+/+ and N = 3 for BDNF+/− mice).

Similar articles

Cited by

References

    1. Aguirre A, Dupree JL, Mangin JM, Gallo V. A functional role for EGFR signaling in myelination and remyelination. Nat Neurosci. 2007;10:990–1002. - PubMed
    1. Aharoni R, Eilam R, Domev H, Labunskay G, Sela M, Arnon R. The immunomodulator glatiramer acetate augments the expression of neurotrophic factors in brains of experimental autoimmune encephalomyelitis mice. Proc Natl Acad Sci U S A. 2005;102:19045–19050. - PMC - PubMed
    1. Althaus HH. Remyelination in multiple sclerosis: a new role for neurotrophins? Prog Brain Res. 2004;146:415–432. - PubMed
    1. Azoulay D, Vachapova V, Shihman B, Miler A, Karni A. Lower brain-derived neurotrophic factor in serum of relapsing remitting MS: reversal by glatiramer acetate. J Neuroimmunol. 2005;167:215–218. - PubMed
    1. Biancotti JC, Kumar S, de Vellis J. Activation of inflammatory response by a combination of growth factors in cuprizone-induced demyelinated brain leads to myelin repair. Neurochem Res. 2008;33:2615–2628. - PubMed

Publication types

MeSH terms