. 2011 Nov 15;71(22):7103-12.
doi: 10.1158/0008-5472.CAN-10-3192. Epub 2011 Oct 5.

Decreased lymphangiogenesis and lymph node metastasis by mTOR inhibition in head and neck cancer

Affiliations

Decreased lymphangiogenesis and lymph node metastasis by mTOR inhibition in head and neck cancer

Vyomesh Patel et al. Cancer Res. .

Erratum in

  • Cancer Res. 2012 Feb 1;72(3):826. Nathan, Cherie Ann [corrected to Nathan, Cherie-Ann O]

Abstract

Despite our improved understanding of cancer, the 5-year survival rate for head and neck squamous cell carcinomas (HNSCC) patients remains relatively unchanged at 50% for the past three decades. HNSCCs often metastasize to locoregional lymph nodes, and lymph node involvement represents one of the most important prognostic factors of poor clinical outcome. Among the multiple dysregulated molecular mechanism in HNSCCs, emerging basic, preclinical, and clinical findings support the importance of the mTOR signaling route in HNSCC progression. Indeed, we observed here that the activation of mTOR is a widespread event in clinical specimens of HNSCCs invading locoregional lymph nodes. We developed an orthotopic model of HNSCC consisting of the implantation of HNSCC cells into the tongues of immunocompromised mice. These orthotopic tumors spontaneously metastasize to the cervical lymph nodes, where the presence of HNSCC cells can be revealed by histologic and immunohistochemical evaluation. Both primary and metastatic experimental HNSCC lesions exhibited elevated mTOR activity. The ability to monitor and quantitate lymph node invasion in this model system enabled us to explore whether the blockade of mTOR could impact HNSCC metastasis. We found that inhibition of mTOR with rapamycin and the rapalog RAD001 diminished lymphangiogenesis in the primary tumors and prevented the dissemination of HNSCC cancer cells to the cervical lymph nodes, thereby prolonging animal survival. These findings may provide a rationale for the future clinical evaluation of mTOR inhibitors, including rapamycin and its analogues, as part of a molecular-targeted metastasis preventive strategy for the treatment of patients with HNSCC.


Conflict of interest statement

Disclosure of Potential Conflicts of Interest: The authors indicate no disclosures of potential conflicts of interest.

Figures

Figure 1
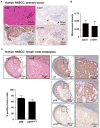
Figure 1. Activation of mTOR in primary and metastatic HNSCC lesions
A. Detection of pS6 and vascular and lymphatic vessels in primary HNSCC lesions. Consecutive sections from a representative HNSCC lesion were stained with H&E, or immunostained for the phosphorylated form of S6, and the vascular (CD31) or lymphatic (LYVE1) endothelial markers, as indicated. Arrows point to the corresponding blood and lymphatic vessels, respectively. B. Microvessel quantification in primary HNSCC tumors immunoreacted with CD31 and LYVE 1 was performed as described in the methods section, using the IHC Microvessels Algorithm (Aperio, Vista, CA). Average and standard error of the mean (SEM) are presented for 5 representative HNSCC cases. Neither blood nor lymphatic vessels were observed in normal oral epithelium (not shown). C. Representative human metastatic lymph node from a patient with oral squamous cell carcinoma, stained for cytokeratins (CK, upper panel), pS6 (middle panel) and pAktS473 (lower panel), showing the high levels of pS6 and pAktS473 expression in the metastatic epithelial cells. The higher magnification show details of the malignant neoplastic cells; note how the areas showing pS6 and pAktS473expression superimpose with the epithelial cell marker cytokeratin. The graphic shows the percentage of pS6 and pAktS473 positive tumors cells in invaded human lymph nodes with SCC tumors, as evaluated by immunohistochemistry. Average and standard error of the mean (SEM) are presented for 8 representative HNSCC cases with invaded lymph nodes.
Figure 2
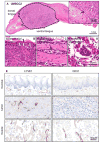
Figure 2. Local invasive growth and lymphangiogenesis of orthotopically implanted HNSCC cells into the tongue
A. H&E stained tissue section of a HNSCC orthotopic tumor (delimited with dotted line) growing into the anterior half of a tongue after 4 weeks post implantation. UMSCC2 is a well differentiated squamous cell carcinoma displaying keratinization (inset, black arrow head) and granular differentiation (inset, white arrow head). B. Intraepithelial invasion by HNSCC cells. The invasive are a is indicated by the white arrows. The black arrow points to the remaining normal epithelium. C. Perineural infiltration. A group of HNSCC cells (black arrow) are seen growing surrounding a nerve structure (white arrow). This was a common finding in this orthotopic HNSCC model. D. Subepithelial lymphatic permeation by HNSCC cells. The carcinoma tends to grow inside the lymphatic vessels (LV); this finding was confirmed by immunohistochemistry (below). E. Immunohistochemistry identification of vascular (CD31) and lymphatic (LYVE 1) endothelial cells was performed and the results quantified in control mice and the HNSCC orthotopic tumors. No blood or lymphatic vessels are observed in normal epithelium. Normal mucosa included the epithelium and subepithelial area between the epithelium and the muscle; muscle refers to the normal skeletal muscle of the tongue, and tumor to the malignant epithelial area and its stroma.
Figure 3
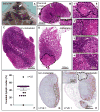
Figure 3. Metastasis of orthotopically implanted HNSCC cells into the tongue to locoregional cervical lymph nodes
A. India ink was injected into the tongue (white thick arrow) as a tracer for the lymphatic vasculature. The ink particles, uptaken by the draining lymphatic vessels circulate into the cervical lymph nodes (thin arrows). B. Distribution of India ink along the subcapsular sinus of a cervical lymph node, as indicated in the inset with yellow arrows. Afferent lymphatic vessels containing ink particles are also shown. The inset shows the black ink particles at a higher magnification. C. Control, non-metastatic cervical lymph node. The picture shows a homogeneous structure in which lymphocytes are the predominant cells, as judged by histological analysis of H&E stained sections. D. Metastatic lymph node. Histological evaluation of H&E stained sections indicate that the representative cervical lymph node includes the metastatic growth of UMSCC2 HNSCC cells in the area rounded by a dotted line.. E. Using a dissection microscope, four to five cervical lymph nodes were isolated from each mice. These four pictures at a high magnification depict the histological features of a representative animal. Lymph nodes 1, and 2 show metastatic involvement, with the tumoral area (*) delimited by a dashed line; 3 and 4 show only reactive changes. F. Percentage of metastatic lymph nodes per animal in mice carrying orthotopic UMSCC2 HNSCC xenografts. Most mice developed cervical lymph nodes metastases within 5 weeks post-tumor cell implantation. G. A histological section of a non-invaded lymph node immunostained with anti-LYVE 1 antibody. A rich network of lymphatic vessels is evident in the cortical area of this node. The staining is mostly distributed in the cortical sinus and the cortex with less reactivity in the medulla. H. In a metastatic lymph node the growing HNSCC tumor (delimited by a dotted line) pushes the lymphatic ducts outward. Within the tumor parenchyma, a few ducts can be seen in the periphery (inset); the central area is necrotic and thus devoid of any structures.
Figure 4
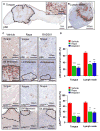
Figure 4. Inhibition of mTOR by rapamycin and RAD001 in HNSCC cells grown orthotopically into the tongue and in their spontaneous lymph node metastases
A. pS6 immunohistochemistry in UMSCC2 HNSCC orthotopic xenografts growing into a mouse tongue. The tumor area, circled by the dotted line, shows a high percentage of pS6-positive cells, as detailed in the inset. The suprabasal layers of the normal squamous epithelium of the tongue as well as other structures, such as the ducts of accessory salivary glands, are also positive. B. A representative metastatic cervical lymph node showing strong immunoreactivity for pS6 in the tumoral area.. C. Detection of pS6 and pAktS473 in HNSCC primary tumors and lymph node metastases in animals administered with vehicle control, rapamycin, and RAD001 for 48 h. There was a remarkable decrease in pS6 and pAktS473 expression after rapamycin and RAD001 treatment. D. The graphic shows the percentage of pS6-positive (upper panel) and pAktS473 (lower panel) tumors cells in primary HNSCC carcinomas (tongue) and their metastases (lymph node), as evaluated by immunohistochemistry. Rapamycin and RAD001 treatments induced a significant reduction in the number of positive cells in the treated tumors and metastases as compared with the control vehicle-treated group. *** p< 0.001, ** p<0.01
Figure 5
Figure 5. Inhibition of mTOR with rapamycin and RAD001 diminishes the growth of primary orthotopic HNSCC tumors
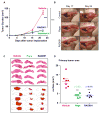
A. Tumor growth in UMSCC2 HNSCC orthotopic xenografts in control vs rapamycin- and RAD001-treated mice. Animals bearing HNSCC tumors into the tongue were randomized into the vehicle (n=37), rapamycin (n=25), and RAD001 (n=25) treated groups, and daily treatment regime initiated. All animals underwent weekly tongue evaluation and tumor growth quantified as described in the Methods section. B. Upper panels show the primary tumor of an early and late stage orthotopic HNSCC lesion treated with vehicle for the indicated days, while the lower panels show a representative mouse treated with rapamycin or RAD001. C. The pictures in the left panels show the individual tongues of representative mice in the vehicle-treated group vs. the rapamycin- and RAD001-treated animals (Rapa, middle, and RAD001, right groups, respectively). The tumor surface was mapped as described in Material and Methods and shown in red in the cartoon in the bottom panel. D. The compromised areas in each tongue were digitally quantified. The surface of the affected area per tongue for each vehicle control and rapamycin-treated mouse is indicated. Average and standard error for each group are indicated. *** p<0.001.
Figure 6
Figure 6. Inhibition of mTOR with rapamycin and RAD001 prevents the metastatic spread of primary HNSCC lesions to cervical lymph nodes, extending animal survival
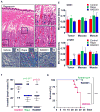
A. Patterns of tumor regression in rapamycin- and RAD001-treated UMSCC2 HNSCC xenograft. After rapamycin treatment, the remnant tumor has become lobulated, with blocks of neoplastic cells divided by dense collagen strands. Similar results were observed in RAD001 treated animals (not shown). In the hematoxylin-eosin stained tissue (inset) the collagen is evident by an increase in eosinophilic material between the cells. The small pictures on the right are higher magnification of the areas depicted as dotted squares, showing two stages in rapamycin-induced regression within the same slide. On top, apoptotic images can be identified within the tumoral mass (arrow heads). In the bottom, intercellular edema and hemorrhages are evident. B–D. The increase in blue-stained collagen bands is evident in the rapamycin and RAD001 treated animal (C and D, respectively) as compared with the vehicle treated mouse (B). Masson trichrome staining. E. Microvessel quantification in primary HNSCC tumors immunoreacted with CD31 and LYVE 1. There were no significant differences in CD31 expression between vehicle controls and rapamycin or RAD001 treated tumors. Rapamycin and RAD001 administration induced a significant decrease of lymphatic vessels density specifically within the tumor area, as judged by LYVE 1 staining (*** p<0.001). F. Percentage of metastatic lymph nodes in each animal in the vehicle- and rapamycin-treated groups. Rapamycin and RAD001 treatments induced a significant decrease the metastatic burden (*** p<0.001, ** p<0.01). G. Survival curve of mice carrying UMSCC2 HNSCC orthotopic xenografts treated with vehicle (n=26), rapamycin (n=20), and RAD001 (n=20). Treatment was started 10 days after HNSCC cell tongue implantation, when visible tumors were evident. As seen, all rapamycin and RAD001 treated animals were alive at the end of the study, while by contrast all animals in the vehicle-treated group succumbed to disease (*** p<0.001).

Similar articles

Cited by

References

    1. Parkin DM, Bray F, Ferlay J, Pisani P. Global cancer statistics, 2002. CA Cancer J Clin. 2005;55:74–108. - PubMed
    1. Jemal A, Siegel R, Ward E, Hao Y, Xu J, Thun MJ. Cancer statistics, 2009. CA Cancer J Clin. 2009;59:225–49. - PubMed
    1. Warnakulasuriya S. Global epidemiology of oral and oropharyngeal cancer. Oral Oncol. 2009;45:309–16. - PubMed
    1. Haddad RI, Shin DM. Recent advances in head and neck cancer. N Engl J Med. 2008;359:1143–54. - PubMed
    1. Forastiere A, Koch W, Trotti A, Sidransky D. Head and neck cancer. N Engl J Med. 2001;345:1890–900. - PubMed

Publication types

MeSH terms