A map of minor groove shape and electrostatic potential from hydroxyl radical cleavage patterns of DNA
- PMID: 21967305
- PMCID: PMC3241897
- DOI: 10.1021/cb200155t
A map of minor groove shape and electrostatic potential from hydroxyl radical cleavage patterns of DNA
Abstract
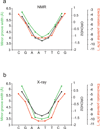
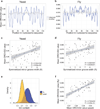
DNA shape variation and the associated variation in minor groove electrostatic potential are widely exploited by proteins for DNA recognition. Here we show that the hydroxyl radical cleavage pattern is a quantitative measure of DNA backbone solvent accessibility, minor groove width, and minor groove electrostatic potential, at single nucleotide resolution. We introduce maps of DNA shape and electrostatic potential as tools for understanding how proteins recognize binding sites in a genome. These maps reveal periodic structural signals in yeast and Drosophila genomic DNA sequences that are associated with positioned nucleosomes.
Figures


Similar articles
-
Experimental maps of DNA structure at nucleotide resolution distinguish intrinsic from protein-induced DNA deformations.Nucleic Acids Res. 2018 Mar 16;46(5):2636-2647. doi: 10.1093/nar/gky033. Nucleic Acids Res. 2018. PMID: 29390080 Free PMC article.
-
A DNA minor groove electronegative potential genome map based on photo-chemical probing.Nucleic Acids Res. 2011 Aug;39(14):6269-76. doi: 10.1093/nar/gkr204. Epub 2011 Apr 8. Nucleic Acids Res. 2011. PMID: 21478164 Free PMC article.
-
Genome-wide prediction of minor-groove electrostatic potential enables biophysical modeling of protein-DNA binding.Nucleic Acids Res. 2017 Dec 1;45(21):12565-12576. doi: 10.1093/nar/gkx915. Nucleic Acids Res. 2017. PMID: 29040720 Free PMC article.
-
What drives proteins into the major or minor grooves of DNA?J Mol Biol. 2007 Jan 5;365(1):1-9. doi: 10.1016/j.jmb.2006.09.059. Epub 2006 Sep 27. J Mol Biol. 2007. PMID: 17055530 Free PMC article. Review.
-
Probing DNA structure with hydroxyl radicals.Curr Protoc Nucleic Acid Chem. 2002 Feb;Chapter 6:Unit 6.7. doi: 10.1002/0471142700.nc0607s07. Curr Protoc Nucleic Acid Chem. 2002. PMID: 18428898 Review.
Cited by
-
Molecular basis for sequence-dependent induced DNA bending.Chembiochem. 2013 Feb 11;14(3):323-31. doi: 10.1002/cbic.201200706. Epub 2013 Jan 25. Chembiochem. 2013. PMID: 23355266 Free PMC article.
-
Experimental maps of DNA structure at nucleotide resolution distinguish intrinsic from protein-induced DNA deformations.Nucleic Acids Res. 2018 Mar 16;46(5):2636-2647. doi: 10.1093/nar/gky033. Nucleic Acids Res. 2018. PMID: 29390080 Free PMC article.
-
Design and synthesis of heterocyclic cations for specific DNA recognition: from AT-rich to mixed-base-pair DNA sequences.J Org Chem. 2014 Feb 7;79(3):852-66. doi: 10.1021/jo402599s. Epub 2014 Jan 21. J Org Chem. 2014. PMID: 24422528 Free PMC article.
-
Quantitative and systematic NMR measurements of sequence-dependent A-T Hoogsteen dynamics uncovers unique conformational specificity in the DNA double helix.bioRxiv [Preprint]. 2024 May 15:2024.05.15.594415. doi: 10.1101/2024.05.15.594415. bioRxiv. 2024. PMID: 38798635 Free PMC article. Preprint.
-
Hidden modes of DNA binding by human nuclear receptors.Nat Commun. 2023 Jul 13;14(1):4179. doi: 10.1038/s41467-023-39577-0. Nat Commun. 2023. PMID: 37443151 Free PMC article.
References
Publication types
MeSH terms
Substances
Grants and funding
LinkOut - more resources
Full Text Sources
Molecular Biology Databases

