Extracting a cellular hierarchy from high-dimensional cytometry data with SPADE
- PMID: 21964415
- PMCID: PMC3196363
- DOI: 10.1038/nbt.1991
Extracting a cellular hierarchy from high-dimensional cytometry data with SPADE
Abstract
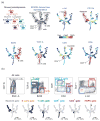
The ability to analyze multiple single-cell parameters is critical for understanding cellular heterogeneity. Despite recent advances in measurement technology, methods for analyzing high-dimensional single-cell data are often subjective, labor intensive and require prior knowledge of the biological system. To objectively uncover cellular heterogeneity from single-cell measurements, we present a versatile computational approach, spanning-tree progression analysis of density-normalized events (SPADE). We applied SPADE to flow cytometry data of mouse bone marrow and to mass cytometry data of human bone marrow. In both cases, SPADE organized cells in a hierarchy of related phenotypes that partially recapitulated well-described patterns of hematopoiesis. We demonstrate that SPADE is robust to measurement noise and to the choice of cellular markers. SPADE facilitates the analysis of cellular heterogeneity, the identification of cell types and comparison of functional markers in response to perturbations.
Figures


Similar articles
-
Toward deterministic and semiautomated SPADE analysis.Cytometry A. 2017 Mar;91(3):281-289. doi: 10.1002/cyto.a.23068. Epub 2017 Feb 24. Cytometry A. 2017. PMID: 28234411 Free PMC article.
-
Revealing the diversity of extracellular vesicles using high-dimensional flow cytometry analyses.Sci Rep. 2016 Oct 27;6:35928. doi: 10.1038/srep35928. Sci Rep. 2016. PMID: 27786276 Free PMC article.
-
Visualization and cellular hierarchy inference of single-cell data using SPADE.Nat Protoc. 2016 Jul;11(7):1264-79. doi: 10.1038/nprot.2016.066. Epub 2016 Jun 16. Nat Protoc. 2016. PMID: 27310265
-
The end of gating? An introduction to automated analysis of high dimensional cytometry data.Eur J Immunol. 2016 Jan;46(1):34-43. doi: 10.1002/eji.201545774. Epub 2015 Nov 30. Eur J Immunol. 2016. PMID: 26548301 Review.
-
Flow cytometry in the post fluorescence era.Best Pract Res Clin Haematol. 2011 Dec;24(4):505-8. doi: 10.1016/j.beha.2011.09.005. Best Pract Res Clin Haematol. 2011. PMID: 22127312 Review.
Cited by
-
Identification of cardiovascular lineage descendants at single-cell resolution.Development. 2015 Mar 1;142(5):846-57. doi: 10.1242/dev.116897. Epub 2015 Jan 29. Development. 2015. PMID: 25633351 Free PMC article.
-
Essential procedures of single-cell RNA sequencing in multiple myeloma and its translational value.Blood Sci. 2023 Nov 2;5(4):221-236. doi: 10.1097/BS9.0000000000000172. eCollection 2023 Oct. Blood Sci. 2023. PMID: 37941914 Free PMC article. Review.
-
A continuous molecular roadmap to iPSC reprogramming through progression analysis of single-cell mass cytometry.Cell Stem Cell. 2015 Mar 5;16(3):323-37. doi: 10.1016/j.stem.2015.01.015. Cell Stem Cell. 2015. PMID: 25748935 Free PMC article.
-
Reprogramming roadmap reveals route to human induced trophoblast stem cells.Nature. 2020 Oct;586(7827):101-107. doi: 10.1038/s41586-020-2734-6. Epub 2020 Sep 16. Nature. 2020. PMID: 32939092
-
CytoSPADE: high-performance analysis and visualization of high-dimensional cytometry data.Bioinformatics. 2012 Sep 15;28(18):2400-1. doi: 10.1093/bioinformatics/bts425. Epub 2012 Jul 10. Bioinformatics. 2012. PMID: 22782546 Free PMC article.
References
-
- Chattopadhyay P, Price D, Harper T, Betts M, Yu J, Gostick E, Perfetto S, Goepfert P, Koup R, De Rosa S, Bruchez M, Roederer M. Quantum dot semiconductor nanocrystals for immunophenotyping by polychromatic flow cytometry. Nature Medicine. 2006;12(8):972–977. - PubMed
-
- Bandura DR, Baranov VI, Ornatsky OI, Antonov A, Kinach R, Lou X, Pavlov S, Vorobiev S, Dick JE, Tanner SD. Mass cytometry: Technique for real time single cell multitarget immunoassay based on inductively coupled plasma time-of-flight mass spectrometry. Analytical Chemistry. 2009;81(16):6813–6822. - PubMed
-
- Herzenberg L, Tung J, Moore W, Herzenberg L, Parks D. Interpreting flow cytometry data: a guide for the perplexed. Nat Immunol. 2006;7(7):681–685. - PubMed
-
- Ellis B, Haaland P, Hahne F, Le Meur N, Gopalakrishnan N. R package version 1.10.0. Flowcore: basic structures for flow cytometry data.
-
- Murphy RF. Automated identification of subpopulations in flow cytometric list mode data using cluster analysis. Cytometry. 1985;6(4):302–309. - PubMed
Publication types
MeSH terms
Substances
Grants and funding
- R01 CA130826-04/CA/NCI NIH HHS/United States
- PN2 EY018228/EY/NEI NIH HHS/United States
- P01 CA034233/CA/NCI NIH HHS/United States
- U19 AI057229/AI/NIAID NIH HHS/United States
- N01-HV-00242/HV/NHLBI NIH HHS/United States
- U54CA149145/CA/NCI NIH HHS/United States
- 5U54 CA143907/CA/NCI NIH HHS/United States
- U54 CA149145/CA/NCI NIH HHS/United States
- HHSN272200700038C/AI/NIAID NIH HHS/United States
- PN2EY018228/EY/NEI NIH HHS/United States
- U56 CA112973/CA/NCI NIH HHS/United States
- R01 CA130826/CA/NCI NIH HHS/United States
- U54 CA143907/CA/NCI NIH HHS/United States
- U56CA112973/CA/NCI NIH HHS/United States
- T15 LM007033/LM/NLM NIH HHS/United States
- 1R01CA130826/CA/NCI NIH HHS/United States
- U54 CA149145-01/CA/NCI NIH HHS/United States
- U56 CA112973-01/CA/NCI NIH HHS/United States
LinkOut - more resources
Full Text Sources
Other Literature Sources

