MS3 eliminates ratio distortion in isobaric multiplexed quantitative proteomics
- PMID: 21963607
- PMCID: PMC3205343
- DOI: 10.1038/nmeth.1714
MS3 eliminates ratio distortion in isobaric multiplexed quantitative proteomics
Abstract
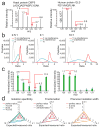
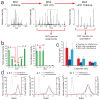
Quantitative mass spectrometry-based proteomics is highly versatile but not easily multiplexed. Isobaric labeling strategies allow mass spectrometry-based multiplexed proteome quantification; however, ratio distortion owing to protein quantification interference is a common effect. We present a two-proteome model (mixture of human and yeast proteins) in a sixplex isobaric labeling system to fully document the interference effect, and we report that applying triple-stage mass spectrometry (MS3) almost completely eliminates interference.
Figures


Comment in
-
Taming the isobaric tagging elephant in the room in quantitative proteomics.Nat Methods. 2011 Oct 28;8(11):911-3. doi: 10.1038/nmeth.1736. Nat Methods. 2011. PMID: 22036744 No abstract available.
Similar articles
-
A Triple Knockout (TKO) Proteomics Standard for Diagnosing Ion Interference in Isobaric Labeling Experiments.J Am Soc Mass Spectrom. 2016 Oct;27(10):1620-5. doi: 10.1007/s13361-016-1434-9. Epub 2016 Jul 11. J Am Soc Mass Spectrom. 2016. PMID: 27400695 Free PMC article.
-
TKO6: A Peptide Standard To Assess Interference for Unit-Resolved Isobaric Labeling Platforms.J Proteome Res. 2019 Jan 4;18(1):565-570. doi: 10.1021/acs.jproteome.8b00902. Epub 2018 Dec 6. J Proteome Res. 2019. PMID: 30481031 Free PMC article.
-
High-resolution quadrupole improves spectral purity and reduces interference from non-target ions in isobaric multiplexed quantitative proteomics.Anal Chim Acta. 2024 Oct 9;1325:343135. doi: 10.1016/j.aca.2024.343135. Epub 2024 Aug 22. Anal Chim Acta. 2024. PMID: 39244297
-
Progress and pitfalls of using isobaric mass tags for proteome profiling.Expert Rev Proteomics. 2020 Feb;17(2):149-161. doi: 10.1080/14789450.2020.1731309. Epub 2020 Feb 20. Expert Rev Proteomics. 2020. PMID: 32067523 Review.
-
Development and application of proteomics technologies in Saccharomyces cerevisiae.Trends Biotechnol. 2005 Dec;23(12):598-604. doi: 10.1016/j.tibtech.2005.09.004. Epub 2005 Oct 3. Trends Biotechnol. 2005. PMID: 16202464 Review.
Cited by
-
Dual proteome-scale networks reveal cell-specific remodeling of the human interactome.Cell. 2021 May 27;184(11):3022-3040.e28. doi: 10.1016/j.cell.2021.04.011. Epub 2021 May 6. Cell. 2021. PMID: 33961781 Free PMC article.
-
Multisystem inflammatory syndrome in children is driven by zonulin-dependent loss of gut mucosal barrier.J Clin Invest. 2021 Jul 15;131(14):e149633. doi: 10.1172/JCI149633. J Clin Invest. 2021. PMID: 34032635 Free PMC article.
-
Quantifying proteomes and their post-translational modifications by stable isotope label-based mass spectrometry.Curr Opin Chem Biol. 2013 Oct;17(5):779-86. doi: 10.1016/j.cbpa.2013.06.011. Epub 2013 Jul 5. Curr Opin Chem Biol. 2013. PMID: 23835517 Free PMC article. Review.
-
Impact of eIF2α phosphorylation on the translational landscape of mouse embryonic stem cells.Cell Rep. 2024 Jan 23;43(1):113615. doi: 10.1016/j.celrep.2023.113615. Epub 2023 Dec 29. Cell Rep. 2024. PMID: 38159280 Free PMC article.
-
Mass Spectrometry-Based Approaches to Understand the Molecular Basis of Memory.Front Chem. 2016 Oct 14;4:40. doi: 10.3389/fchem.2016.00040. eCollection 2016. Front Chem. 2016. PMID: 27790611 Free PMC article. Review.
References
Publication types
MeSH terms
Grants and funding
LinkOut - more resources
Full Text Sources
Other Literature Sources

