Genome-wide translocation sequencing reveals mechanisms of chromosome breaks and rearrangements in B cells
- PMID: 21962511
- PMCID: PMC3186939
- DOI: 10.1016/j.cell.2011.07.049
Genome-wide translocation sequencing reveals mechanisms of chromosome breaks and rearrangements in B cells
Erratum in
- Cell. 2011 Dec 23;147(7):1640
Abstract
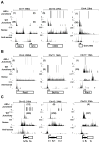
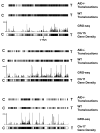
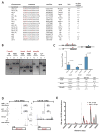
Whereas chromosomal translocations are common pathogenetic events in cancer, mechanisms that promote them are poorly understood. To elucidate translocation mechanisms in mammalian cells, we developed high-throughput, genome-wide translocation sequencing (HTGTS). We employed HTGTS to identify tens of thousands of independent translocation junctions involving fixed I-SceI meganuclease-generated DNA double-strand breaks (DSBs) within the c-myc oncogene or IgH locus of B lymphocytes induced for activation-induced cytidine deaminase (AID)-dependent IgH class switching. DSBs translocated widely across the genome but were preferentially targeted to transcribed chromosomal regions. Additionally, numerous AID-dependent and AID-independent hot spots were targeted, with the latter comprising mainly cryptic I-SceI targets. Comparison of translocation junctions with genome-wide nuclear run-ons revealed a marked association between transcription start sites and translocation targeting. The majority of translocation junctions were formed via end-joining with short microhomologies. Our findings have implications for diverse fields, including gene therapy and cancer genomics.
Copyright © 2011 Elsevier Inc. All rights reserved.
Figures
Comment in
-
Translocation mapping exposes the risky lifestyle of B cells.Cell. 2011 Sep 30;147(1):20-2. doi: 10.1016/j.cell.2011.09.005. Cell. 2011. PMID: 21962501
-
Cancer genomics: Translocation patterns revealed.Nat Rev Genet. 2011 Oct 18;12(11):741. doi: 10.1038/nrg3090. Nat Rev Genet. 2011. PMID: 22005978 No abstract available.
Similar articles
-
Translocation-capture sequencing reveals the extent and nature of chromosomal rearrangements in B lymphocytes.Cell. 2011 Sep 30;147(1):95-106. doi: 10.1016/j.cell.2011.07.048. Cell. 2011. PMID: 21962510 Free PMC article.
-
Developmental propagation of V(D)J recombination-associated DNA breaks and translocations in mature B cells via dicentric chromosomes.Proc Natl Acad Sci U S A. 2014 Jul 15;111(28):10269-74. doi: 10.1073/pnas.1410112111. Epub 2014 Jun 30. Proc Natl Acad Sci U S A. 2014. PMID: 24982162 Free PMC article.
-
DSB structure impacts DNA recombination leading to class switching and chromosomal translocations in human B cells.PLoS Genet. 2019 Apr 4;15(4):e1008101. doi: 10.1371/journal.pgen.1008101. eCollection 2019 Apr. PLoS Genet. 2019. PMID: 30946744 Free PMC article.
-
Myc translocations in B cell and plasma cell neoplasms.DNA Repair (Amst). 2006 Sep 8;5(9-10):1213-24. doi: 10.1016/j.dnarep.2006.05.017. Epub 2006 Jul 11. DNA Repair (Amst). 2006. PMID: 16815105 Review.
-
Translocations in normal B cells and cancers: insights from new technical approaches.Adv Immunol. 2013;117:39-71. doi: 10.1016/B978-0-12-410524-9.00002-5. Adv Immunol. 2013. PMID: 23611285 Review.
Cited by
-
Perspectives of integrative cancer genomics in next generation sequencing era.Genomics Inform. 2012 Jun;10(2):69-73. doi: 10.5808/GI.2012.10.2.69. Epub 2012 Jun 30. Genomics Inform. 2012. PMID: 23105932 Free PMC article.
-
Oncogenic Myc translocations are independent of chromosomal location and orientation of the immunoglobulin heavy chain locus.Proc Natl Acad Sci U S A. 2012 Aug 21;109(34):13728-32. doi: 10.1073/pnas.1202882109. Epub 2012 Aug 6. Proc Natl Acad Sci U S A. 2012. PMID: 22869734 Free PMC article.
-
Disparate pathways for extrachromosomal DNA biogenesis and genomic DNA repair.bioRxiv [Preprint]. 2023 Oct 23:2023.10.22.563489. doi: 10.1101/2023.10.22.563489. bioRxiv. 2023. Update in: Cancer Discov. 2025 Jan 13;15(1):69-82. doi: 10.1158/2159-8290.CD-23-1117 PMID: 37961138 Free PMC article. Updated. Preprint.
-
Transcriptional stalling in B-lymphocytes: a mechanism for antibody diversification and maintenance of genomic integrity.Transcription. 2013 May-Jun;4(3):127-35. doi: 10.4161/trns.24556. Epub 2013 Apr 12. Transcription. 2013. PMID: 23584095 Free PMC article. Review.
-
Nbs1 ChIP-Seq Identifies Off-Target DNA Double-Strand Breaks Induced by AID in Activated Splenic B Cells.PLoS Genet. 2015 Aug 11;11(8):e1005438. doi: 10.1371/journal.pgen.1005438. eCollection 2015 Aug. PLoS Genet. 2015. PMID: 26263206 Free PMC article.
References
-
- Arnould S, Delenda C, Grizot S, Desseaux C, Paques F, Silva GH, Smith J. The I-CreI meganuclease and its engineered derivatives: applications from cell modification to gene therapy. Protein Eng Des Sel. 2011;24:27–31. - PubMed
-
- Chaudhuri J, Basu U, Zarrin A, Yan C, Franco S, Perlot T, Vuong B, Wang J, Phan RT, Datta A, et al. Evolution of the immunoglobulin heavy chain class switch recombination mechanism. Adv Immunol. 2007;94:157–214. - PubMed
Publication types
MeSH terms
Substances
Grants and funding
LinkOut - more resources
Full Text Sources
Other Literature Sources
Molecular Biology Databases

