. 2011 Sep;23(9):3335-52.
doi: 10.1105/tpc.111.089870. Epub 2011 Sep 27.

The basic helix-loop-helix transcription factor MYC2 directly represses PLETHORA expression during jasmonate-mediated modulation of the root stem cell niche in Arabidopsis

Affiliations

The basic helix-loop-helix transcription factor MYC2 directly represses PLETHORA expression during jasmonate-mediated modulation of the root stem cell niche in Arabidopsis

Qian Chen et al. Plant Cell. 2011 Sep.

Abstract

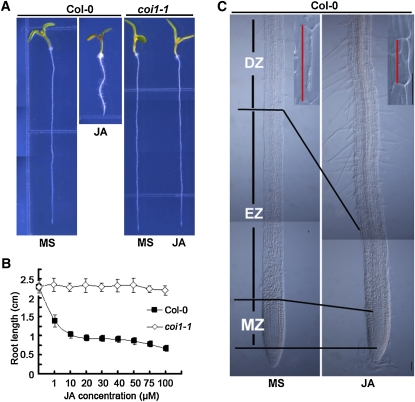
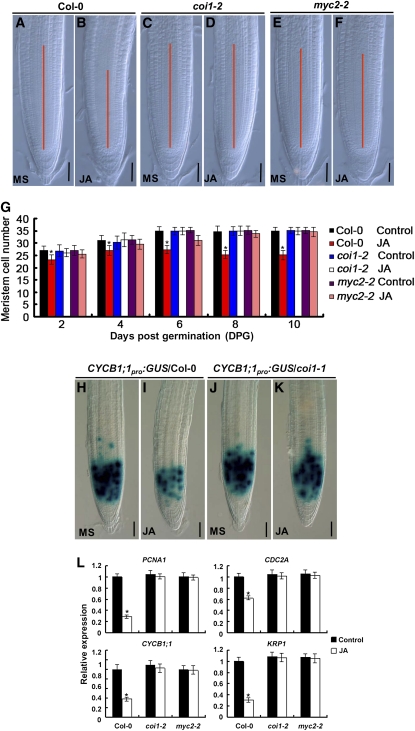
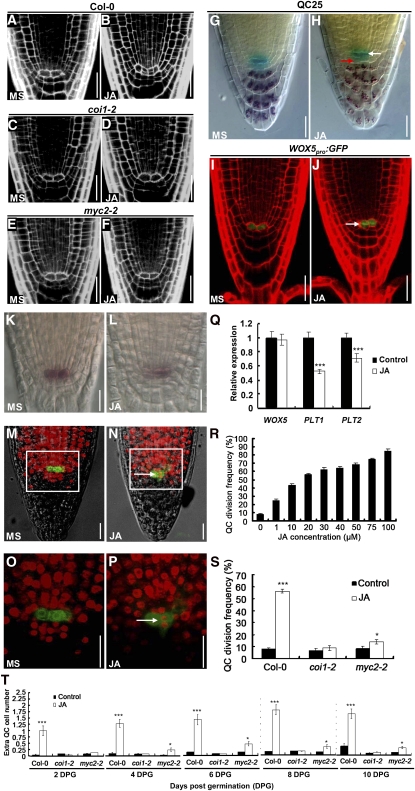
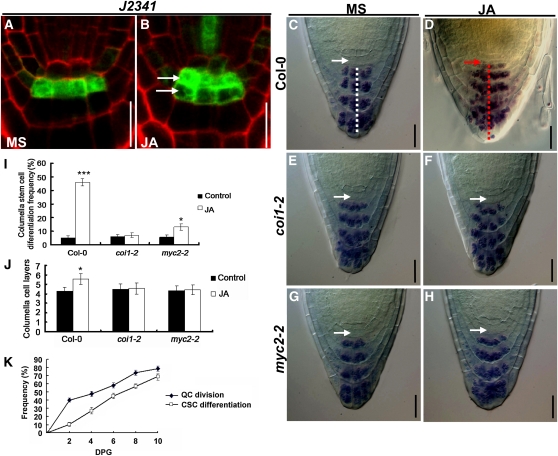
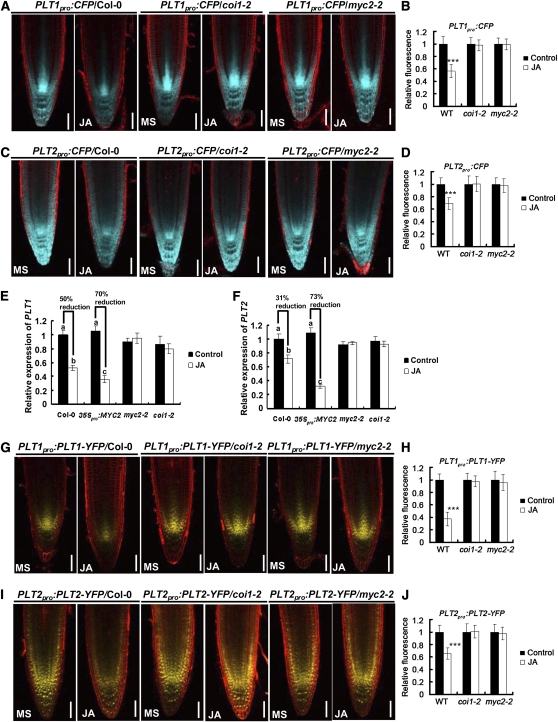
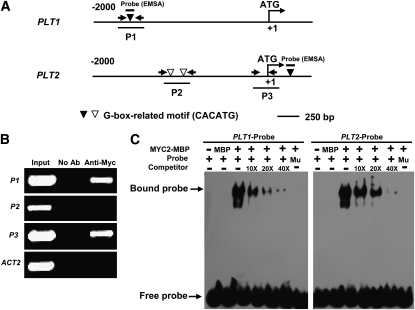
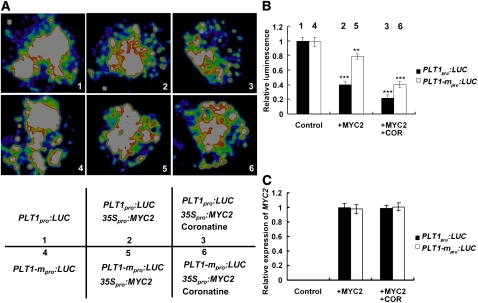
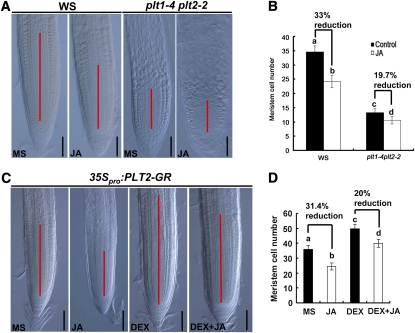
The root stem cell niche, which in the Arabidopsis thaliana root meristem is an area of four mitotically inactive quiescent cells (QCs) and the surrounding mitotically active stem cells, is critical for root development and growth. We report here that during jasmonate-induced inhibition of primary root growth, jasmonate reduces root meristem activity and leads to irregular QC division and columella stem cell differentiation. Consistently, jasmonate reduces the expression levels of the AP2-domain transcription factors PLETHORA1 (PLT1) and PLT2, which form a developmentally instructive protein gradient and mediate auxin-induced regulation of stem cell niche maintenance. Not surprisingly, the effects of jasmonate on root stem cell niche maintenance and PLT expression require the functioning of MYC2/JASMONATE INSENSITIVE1, a basic helix-loop-helix transcription factor that involves versatile aspects of jasmonate-regulated gene expression. Gel shift and chromatin immunoprecipitation experiments reveal that MYC2 directly binds the promoters of PLT1 and PLT2 and represses their expression. We propose that MYC2-mediated repression of PLT expression integrates jasmonate action into the auxin pathway in regulating root meristem activity and stem cell niche maintenance. This study illustrates a molecular framework for jasmonate-induced inhibition of root growth through interaction with the growth regulator auxin.


Figures

Figure 1.
Figure 1.
JA Represses Root Growth through Inhibition of both Cell Proliferation and Cell Elongation. (A) Six-day-old seedlings of the wild type (Col-0) and coi1-1 were grown on medium without (MS) or with 20 μM JA. (B) JA-mediated inhibition of root growth in Col-0 and coi1-1. Col-0 and coi1-1 seeds were germinated on medium containing different concentrations of JA, and seedling root length was measured at 6 d after germination. The effects of JA on Col-0 and coi1-1 were significantly different. Data shown are average and sd (n > 20) and are representative of at least three independent experiments. (C) JA reduces the MZ, the EZ, and epidermal cell length of the DZ. A representative image of 6-d-old Col-0 seedlings grown in the absence or presence of JA. Insets show that JA reduces cell length (marked with red lines) of Col-0 epidermal cells in the DZ. Bars = 50 μm.
Figure 2.
Figure 2.
JA Reduces Cell Division Activity of the Root Meristem in the Wild Type but Not in coi1-2 and myc2-2. (A) to (F) Root meristems of 6-d-old Col-0, coi1-2, and myc2-2 seedlings grown on medium without (MS) or with 20 μM JA. The meristem zone was marked with red line. Bars = 50 μm. (G) JA-induced reduction of root meristem cell number in Col-0, coi1-2, and myc2-2. Seedlings of the indicated genotypes were grown on medium without (MS) or with 20 μM JA, and cell number in the root meristem was examined at a 2-d interval. Data shown are average and sd (n = 20). Asterisks denote Student’s t test significance compared with untreated plants: *P < 0.05. (H) to (K) JA-induced reduction of CYCB1;1pro:GUS expression in Col-0 and coi1-1. Five-day-old seedlings germinated on control medium were transferred to medium without (MS) or with 20 μM JA for 1 d, and the CYCB1;1pro:GUS expression was monitored. Bars = 50 μm. (L) JA-regulated expression of cell cycle–related genes in Col-0, coi1-2, and myc2-2. Five-day-old Col-0 seedlings germinated on control medium were transferred to liquid medium without (control) or with 20 μM JA for 6 h, and 2-mm root tips were harvested for RNA extraction and qRT-PCR analysis. Transcript levels of cell cycle–related genes were normalized to ACTIN2 expression. The transcript levels of the indicated genes in Col-0 without JA treatment were arbitrarily set to 1. Error bars represent the sd of triplicate reactions of independent RNA samples prepared from three batches of Arabidopsis roots. Asterisks denote Student’s t test significance compared with untreated plants: *P < 0.05.
Figure 3.
Figure 3.
JA-mediated Promotion of QC Division in the Wild Type, coi1-2, and myc2-2. (A) to (F) Representative confocal images showing that JA promotes QC division in Col-0 but not in coi1-2 and myc2-2. Five-day-old seedlings were transferred to medium without (MS) or with 20 μM JA for another day before QC division was monitored. Bars = 20 μm. (G) and (H) JA induces QC division and CSC differentiation as revealed by Lugol staining of the QC25 marker line. Five-day-old seedlings of the QC25 marker line were transferred to medium without (MS) or with 100 μM JA for 1 d before GUS (blue) and Lugol (dark brown) double stainings were performed. White arrow indicates no starch accumulation in the irregular QC cells. Red arrow shows starch accumulation in the irregular CSCs. Bars = 20 μm. (I) and (J) JA-induced QC division in the QC marker line WOX5pro:GFP. Five-day-old seedlings of WOX5pro:GFP were transferred to medium without (MS) or with 20 μM JA for another day before QC division was monitored. White arrows mark the cell divisions in the QC. Bars = 20 μm. (K) and (L) Whole-mount in situ hybridization with a WOX5-specific probe showing that JA causes supernumerary QC cells. Roots of seedlings 5 d after germination grown on medium without (MS) or with 20 μM JA were used for whole-mount in situ hybridization. Bars = 20 μm. (M) to (P) EdU incorporation assays showing that JA promotes QC division. Two-day-old WOX5pro:GFP seedlings grown on medium without (MS) ([M] and [O]) or with 100 μM JA treatment ([N] and [P]) were cultured with EdU for 1 d before EdU incorporation in the QC was examined. (O) represents the outlined area in (M), and (P) represents the outlined area in (N). Red fluorescence of EdU-positive nuclei in QC cells of JA-treated roots indicates that QC is in a state of active division (white arrow). Bars = 20 μm. (Q) JA-induced WOX5 expression revealed by qRT-PCR. Five-day-old Col-0 seedlings germinated on control medium were transferred to liquid medium without (control) or with 20 μM JA for 6 h, and 2-mm root tips were harvested for RNA extraction and qRT-PCR analysis. WOX5, PLT1, and PLT2 transcription levels without JA treatment were arbitrarily set to 1. Error bars represent the sd of triplicate reactions of independent RNA samples prepared from three batches of Arabidopsis roots. Asterisks denote Student’s t test significance compared with untreated plants: ***P < 0.001. (R) Dose-dependent effect of JA on QC division in Col-0 roots. Col-0 seedlings were grown on medium containing indicated concentrations of JA for 6 d before QC division frequency (percentage of seedlings with obvious QC division) was determined. At least 50 seedlings were examined for each concentration for each biological repeat. Data shown are average and sd and are representative of at least three independent experiments. (S) JA-induced QC division frequency in Col-0, coi1-2, and myc2-2. Seedlings were grown on medium without (Control) or with 20 μM JA for 6 d before QC division frequency was determined. At least 50 seedlings were examined for each biological repeat. Data shown are average and sd and are representative of at least three independent experiments. Asterisks denote Student’s t test significance compared with untreated plants: *P < 0.05 and ***P < 0.001. (T) Time course of JA-induced extra QC cells in Col-0, coi1-2, and myc2-2. Seeds of the indicated genotypes were germinated on medium without (Control) or with 20 μM JA for 10 d, and extra QC cells were quantified at a 2-d interval. The effects of JA on Col-0 compared with coi1-2 and myc2-2 were significantly different. At least 50 seedlings were examined for each biological repeat. Data shown are average and sd and are representative of at least three independent experiments. Asterisks denote Student’s t test significance compared with untreated plants: *P < 0.05 and ***P < 0.001.
Figure 4.
Figure 4.
JA-Mediated Promotion of CSC Differentiation in the Wild Type, coi1-2, and myc2-2. (A) and (B) JA induces deregulated division of CSCs, as revealed by the CSC-specific marker J2341. Five-day-old seedlings of the J2341 marker line were transferred to medium without (MS) or with 20 μM JA for 1 d before GFP expression in CSCs was examined. White arrows indicate the presence of two CSC layers in JA-treated roots. Bars = 20 μm. (C) to (H) Lugol staining showing that JA induces CSC differentiation in Col-0 ([C] and [D]) but not in coi1-2 ([E] and [F]) and myc2-2 ([G] and [H]). Five-day-old seedlings were transferred to medium without (MS) or with 20 μM JA for 1 d before Lugol staining was performed. Nondifferentiated CSCs (white arrows) below the QC are characterized by the absence of starch granules, whereas starch granules are visible in differentiated CSCs (red arrow). The white dashed line in (C) indicates the well-organized columella cell layers of untreated wild-type roots. The red dashed line in (D) indicates increased and disorganized columella cell layers of JA-treated wild-type roots. Bars = 20 μm. (I) JA-induced CSC differentiation frequency in Col-0, coi1-2, and myc2-2. Seedlings were grown on medium without (Control) or with 20 μM JA for 6 d before CSC differentiation frequency was determined. At least 50 seedlings were examined for each genotype for each experiment. Data shown are average and sd and are representative of at least three independent experiments. Asterisks denote Student’s t test significance compared with untreated plants: *P < 0.05 and ***P < 0.001. (J) JA induces extra columella cell layers in Col-0 but not in coi1-2 and myc2-2. Seedlings were grown on medium without (Control) or with 20 μM JA for 6 d before columella cell layers were determined. At least 50 seedlings were examined for each genotype for each experiment. Data shown are average and sd and are representative of at least three independent experiments. Asterisks denote Student’s t test significance compared with untreated plants: *P < 0.05. (K) Kinetics of JA-induced QC division and CSC differentiation. Col-0 seeds were germinated on medium containing 20 μM JA (JA), and QC division frequency and CSC differentiation frequency were determined at a 2-d interval. At least 50 seedlings were examined for each biological repeat. Data shown are average and sd and are representative of at least three independent experiments.
Figure 5.
Figure 5.
JA Reduces the Expression of PLT1 and PLT2 through COI1 and MYC2. (A) JA reduces PLT1pro:CFP expression levels in Col-0, but not in coi1-2 and myc2-2. (B) Quantification of CFP fluorescence shown in (A). (C) JA reduces PLT2pro:CFP expression levels in Col-0, but not in coi1-2 and myc2-2. (D) Quantification of CFP fluorescence shown in (C). For (A) to (D), 5-d-old seedlings were transferred to medium without (MS) or with 20 μM JA for 1 d before CFP fluorescence was monitored. Data shown are average and sd (n = 15 to 20). Asterisks denote Student’s t test significance compared with untreated plants: ***P < 0.001. Bars = 50 μm. (E) and (F) qRT-PCR assay showing that JA downregulates the transcription of PLT1 (E) and PLT2 (F) in a COI1- and MYC2-dependent manner. Five-day-old seedlings germinated on MS medium were transferred to medium without (Control) or with 20 μM JA for 1 d, and 2-mm root tips were harvested for RNA extraction and qRT-PCR analysis. The transcript levels of PLT1 and PLT2 were normalized to the ACTIN2 expression. PLT1 and PLT2 transcription levels of Col-0 without JA treatment were arbitrarily set to 1. Data presented are mean values of four biological repeats with sd. Samples with different letters are significantly different: P < 0.01. (G) JA reduces PLT1pro:PLT1-YFP expression levels in Col-0, but not in coi1-2 and myc2-2. (H) Quantification of YFP fluorescence shown in (G). Data shown are average and sd (n = 15 to 20). Asterisks denote Student’s t test significance compared with untreated plants: ***P < 0.001. (I) JA reduces PLT2pro:PLT2-YFP expression levels in Col-0, but not in coi1-2 and myc2-2. (J) Quantification of YFP fluorescence shown in (I). Data shown are average and sd (n = 15 to 20). Asterisks denote Student’s t test significance compared with untreated plants: ***P < 0.001. For (G) to (J), 5-d-old seedlings were transferred to medium without (MS) or with 20 μM JA for 1 d before YFP fluorescence was monitored. Bars = 50 μm.
Figure 6.
Figure 6.
MYC2 Associates with PLT1 and PLT2 Promoters. (A) Schematic diagram of potential MYC2 binding sites (white and black triangles), DNA fragments (P1, P2, and P3) used for ChIP, and probes used for EMSA. The sequence 2 kb upstream of the start site and part of the coding sequence for PLT1 and PLT2 are shown. The translational start site (ATG) is shown at position +1. (B) Enrichment of the indicated DNA fragments (P1 and P3) following ChIP using anti-Myc antibodies. Chromatin of transgenic plants expressing 35Spro:MYC2-4Myc was immunoprecipitated with anti-Myc antibodies, and the presence of the indicated DNA in the immune complex was determined by RT-PCR. The Actin2 promoter fragment was used as a negative control. The experiment was repeated three times with similar results. (C) EMSA showing that the MYC2-MBP fusion protein binds to the DNA probes of PLT1 and PLT2 in vitro. Biotin-labeled probes were incubated with MYC2-MBP protein, and the free and bound DNAs (arrows) were separated in an acrylamide gel. As indicated, unlabeled probes were used as competitors. Mu, mutated probe in which the 5′-CACATG-3′ motif was deleted.
Figure 7.
Figure 7.
MYC2 Represses PLT1 Expression, as Revealed by Transient Assays of N. benthamiana leaves. (A) Transient expression assays showing that MYC2 represses the expression of PLT1. Representative images of N. benthamiana leaves 72 h after infiltration are shown. The bottom panel indicates the infiltrated constructs and treatments. (B) Quantitative analysis of luminescence intensity in (A). Five independent determinations were assessed. Error bars represent sd. Asterisks denote Student’s t test significance compared with control plants: **P < 0.01 and ***P < 0.001. (C) qRT-PCR analysis of MYC2 expression in the infiltrated leaf areas shown in (A). Total RNAs were extracted from leaves of N. benthamiana coinfiltrated with the constructs. Five independent determinations were assessed. Error bars represent sd.
Figure 8.
Figure 8.
JA-induced Root Meristem Cell Number in plt1-4 plt2-2 and PLT2-overexpression Plants. (A) JA-induced reduction of meristem size in wild-type (Wassilewskija [WS]) and plt1-4 plt2-2 plants. Seedlings were grown on medium without (MS) or with 20 μM JA for 4 d before meristem cell number was determined. The MZ is marked with a red line. Bars = 50 μm. (B) Quantification of meristem cell number in (A). Data shown are average and sd (n = 20). Samples with different letters are significantly different: P < 0.05. These experiments were repeated at least three times with similar results. (C) JA-induced reduction of root meristem size in transgenic plants expressing 35Spro:PLT2-GR. Bars = 50 μm. (D) Statistics of the meristem cell number shown in (C). Data shown are average and sd (n = 15 to 20). Samples with different letters are significantly different: P < 0.01. These experiments were repeated at least three times with similar results. For (C) and (D), 4-d-old seedlings germinated on MS medium were transferred to control medium (MS) or medium containing 2 μM DEX for another 2 d before root meristem cell number was determined. Four-day-old seedlings germinated on medium with 20 μM JA were transferred to medium with 20 μM JA + 2 μM DEX (DEX + JA) or 20 μM JA only (JA) for another 2 d before root meristem cell number was determined.

Similar articles

Cited by

References

    1. Aida M., Beis D., Heidstra R., Willemsen V., Blilou I., Galinha C., Nussaume L., Noh Y.S., Amasino R., Scheres B. (2004). The PLETHORA genes mediate patterning of the Arabidopsis root stem cell niche. Cell 119: 109–120 - PubMed
    1. Alonso J.M., Hirayama T., Roman G., Nourizadeh S., Ecker J.R. (1999). EIN2, a bifunctional transducer of ethylene and stress responses in Arabidopsis. Science 284: 2148–2152 - PubMed
    1. Alonso J.M., et al. (2003b). Genome-wide insertional mutagenesis of Arabidopsis thaliana. Science 301: 653–657 - PubMed
    1. Alonso J.M., Stepanova A.N., Solano R., Wisman E., Ferrari S., Ausubel F.M., Ecker J.R. (2003a). Five components of the ethylene-response pathway identified in a screen for weak ethylene-insensitive mutants in Arabidopsis. Proc. Natl. Acad. Sci. USA 100: 2992–2997 - PMC - PubMed
    1. Bechtold N., Pelletier G. (1998). In planta Agrobacterium-mediated transformation of adult Arabidopsis thaliana plants by vacuum infiltration. Methods Mol. Biol. 82: 259–266 - PubMed

Publication types

MeSH terms

LinkOut - more resources