. 2011 Nov 22;50(46):9998-10012.
doi: 10.1021/bi200998y. Epub 2011 Oct 26.

Post-translational modifications and lipid binding profile of insect cell-expressed full-length mammalian synaptotagmin 1

Affiliations
Free PMC article

Post-translational modifications and lipid binding profile of insect cell-expressed full-length mammalian synaptotagmin 1

Marija Vrljic et al. Biochemistry. .
Free PMC article

Abstract

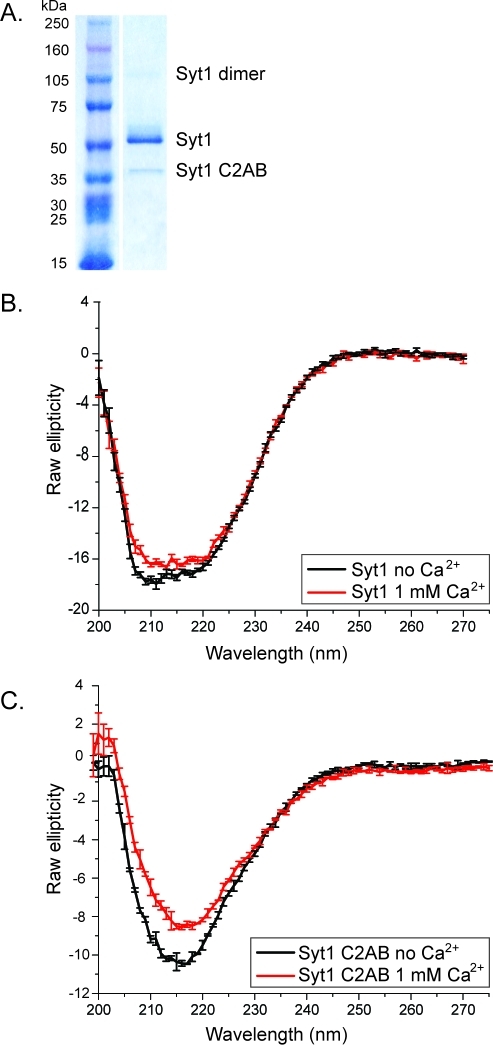
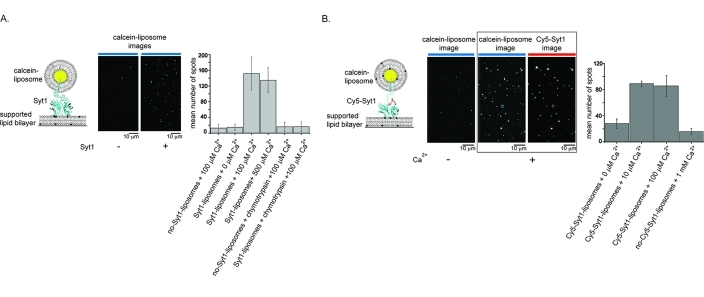
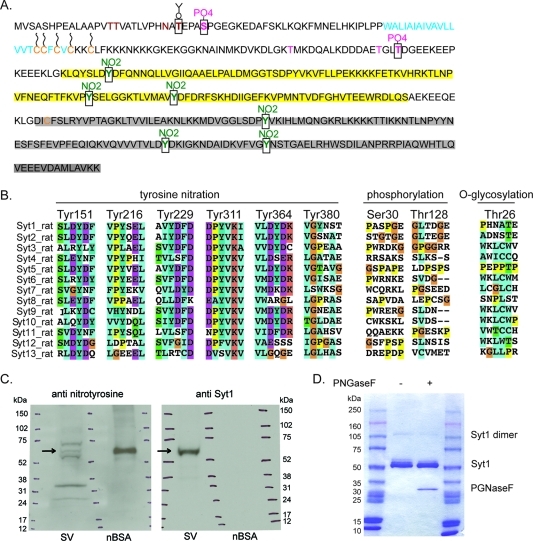
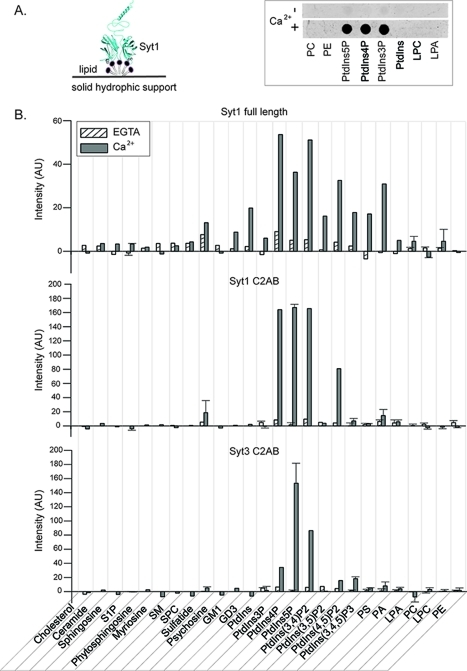
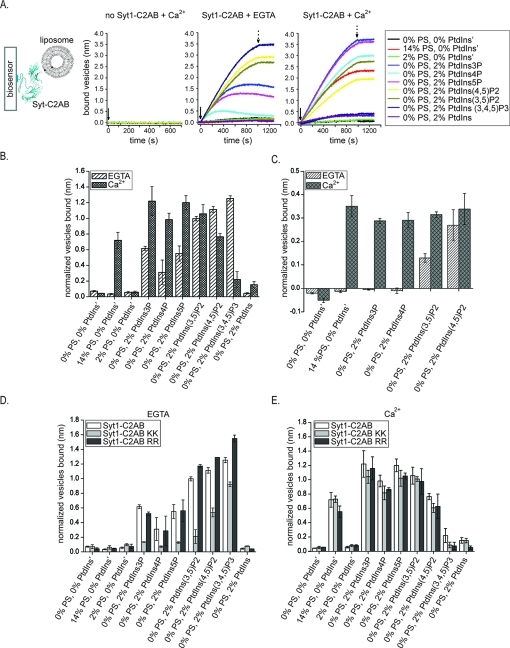
Synaptotagmin 1 (Syt1) is a Ca(2+) sensor for SNARE-mediated, Ca(2+)-triggered synaptic vesicle fusion in neurons. It is composed of luminal, transmembrane, linker, and two Ca(2+)-binding (C2) domains. Here we describe expression and purification of full-length mammalian Syt1 in insect cells along with an extensive biochemical characterization of the purified protein. The expressed and purified protein is properly folded and has increased α-helical content compared to the C2AB fragment alone. Post-translational modifications of Syt1 were analyzed by mass spectrometry, revealing the same modifications of Syt1 that were previously described for Syt1 purified from brain extract or mammalian cell lines, along with a novel modification of Syt1, tyrosine nitration. A lipid binding screen with both full-length Syt1 and the C2AB fragments of Syt1 and Syt3 isoforms revealed new Syt1-lipid interactions. These results suggest a conserved lipid binding mechanism in which Ca(2+)-independent interactions are mediated via a lysine rich region of the C2B domain while Ca(2+)-dependent interactions are mediated via the Ca(2+)-binding loops.


Figures

Figure 1
Figure 1
Purity and circular dichroism spectra of insect cell-expressed and -purified Syt1. (A) Coomassie-stained 4 to 15% SDS–PAGE gel of affinity-purified, Hi5-expressed, full-length Syt1. (B) Circular dichroism spectra of full-length Syt1 in the presence and absence of Ca2+. (C) Circular dichroism spectra of the E. coli-expressed Syt1-C2AB fragment in the presence and absence of Ca2+.
Figure 2
Figure 2
Full-length Syt1 binds PS bilayers in a Ca2+-dependent manner. (A) Binding of full-length Syt1 reconstituted into 100% PC liposomes, fluorescently labeled with the aqueous content dye, calcein, to 80:20 PC/PS supported lipid bilayers is dependent on Ca2+ and Syt1. The left panel shows a cartoon of the experiment. The middle panels show representative images of supported lipid bilayers in the presence and absence of Syt1 where bright spots are calcein-labeled liposomes. The blue lines on top of the images represent the wavelength of the excitation laser (488 nm). The right panel shows the mean number of calcein-bound liposomes bound to the bilayer after a 5 min incubation and after unbound liposomes were washed off with buffer containing the respective amount of Ca2+. Error bars indicate the standard deviation. (B) Binding of fluorescently labeled full-length Syt1 reconstituted into 80:20 PC/PS liposomes to supported lipid bilayers is dependent on Ca2+. Fluorescently labeled Syt1 was reconstituted in 80:20 PC/PS aqueous content labeled liposomes and incubated over 80:20 PC/PS bilayers for 20 min at different Ca2+ concentrations. The left panel shows a cartoon of the experiment. The three middle panels show representative images of supported lipid bilayers in the absence of Ca2+ (left image) and presence of Ca2+ (middle and right images). The lines on top of the images represent the wavelengths of the excitation laser (blue for 488 nm and red for 635 nm). The two images in the presence of Ca2+ show the same field of view that is optically split into two channels to monitor labeled liposomes and labeled Syt1. An example of a colocalized Syt1 and liposome spot is marked in red and blue, respectively. The right panel shows the average number of Syt1-liposomes bound by counting the number of spots colocalized to the supported lipid bilayer imaged after unbound liposomes were washed off with buffer containing the respective amount of Ca2+. Error bars indicate the standard deviation. Note that the concentration of Syt1-liposomes was different from that for the experiments shown in panel A. For both experiments, the number of spots was counted in four different 80 μm × 80 μm areas of the bilayer for two different bilayers.
Figure 3
Figure 3
Post-translational modifications of Syt1. (A) Shown is the sequence of Syt1 from R. norvegicus along with Syt1 post-translational modifications. The transmembrane domain is colored cyan (residues 58–79), the C2A domain yellow (residues 143–264), and the C2B domain gray (residues 274–377). Cysteine residues are colored orange (Cys74, Cys75, Cys77, Cys79, Cys82, and Cys277). Cysteines predicted to be palmitoylated are marked with wavy lines (Cys74, Cys75, Cys77, Cys79, and Cys82). Residues reported in the literature as glycosylated are colored brown (Thr15, Thr16, and Asn24). Residues reported in the literature as phoshorylated (Thr112, Thr127, and Thr128) are colored magenta. Post-translational modifications identified here by mass spectrometry are marked by black squares: Thr26 (O-glycosylated, colored brown), Ser30 and Thr128 (phoshorylated, colored magenta), and Tyr151, Tyr216, Tyr229, Tyr311, Tyr364, and Tyr380 (nitrated, colored green). (B) Local sequence alignments of R. norvegicus synaptotagmin isoforms for residues carrying post-translational modifications identified here by mass spectrometry: tyrosine nitration, phosphorylation, and O-glycosylation, as indicated on top of the sequences. The post-translationally modified residue numbers correspond to those of Syt1. (C) Detection of proteins with nitrated tyrosines in synaptic vesicles. Shown is a representative Western blot of rat synaptic vesicles (SV). A 4 to 15% SDS–PAGE gel was blotted first with primary anti-nitrotyrosine antibody (left) and then with primary anti-synaptotagmin 1 antibody (right). SDS–PAGE molecular mass markers (shown as ticks in three lanes in each gel) have been marked on both films with a pen on the basis of the locations of the SDS–PAGE molecular mass markers on the Western blot membrane. Arrows point to the location of Syt1. Nitrotyrosine BSA (nBSA) was used as a positive and negative control. (D) SDS–PAGE gel (4 to 15%) stained with Commassie dye of insect cell-expressed and -purified Syt1 treated with PNGaseF or not treated, as indicated. Right and left lanes contained molecular mass markers.
Figure 4
Figure 4
Lipid binding screen using a lipid overlay assay. (A) Schematic of the lipid overlay assay (left). Full-length Syt1 (cyan) is shown bound to a lipid spot composed of a single lipid species (gray). The right panel shows a representative example of a lipid strip from a lipid overlay assay showing the lipid binding profile of the biotin-tagged Syt1-C2AB fragment (for full names of lipid acronyms, see below). Each dark spot on the strip corresponds to a Syt1-C2AB fragment bound to a single lipid species. (B) Lipid binding profile of full-length Syt1 and Syt1-C2AB and Syt3-C2AB fragments. After incubation with Syt in the presence (gray bars) or absence (striped white bars) of Ca2+, chromogenic or fluorescence intensities of all spots on Lipid Strips were integrated and corrected for background intensities. The shown intensities are in arbitrary units (AU). The reproducibility of lipid binding was tested for a subset of lipids: error bars represent standard deviations from means of two or three independent experiments. Abbreviations: S1P, sphingosine 1-phosphate; SM, sphingomyelin; SPC, sphingosylphosphorylcholine; Sulfatide, 3-sulfogalactosyl ceramide; Psychosine, galactosylsphingosine; GM1, monosialoganglioside; GD3, disialoganglioside; PtdIns, phosphatidylinositol; PtdIns3P, phosphatidylinositol 3-phosphate; PtdIns4P, phosphatidylinositol 4-phosphate; PtdIns5P, phosphatidylinositol 5-phosphate; PtdIns(3,4)P2, phosphatidylinositol 3,4-bisphosphate; PtdIns(3,5)P2, phosphatidylinositol 3,5-bisphosphate; PtdIns(4,5)P2, phosphatidylinositol 4,5-bisphosphate; PtdIns(3,4,5)P3, phosphatidylinositol 3,4,5-trisphosphate; PS, phosphatidylserine; PA, phosphatidic acid; LPA, lysophosphatidic acid; PC, phosphatidylcholine; LPC, lysophosphatidylcholine; PE, phosphatidylethanolamine.
Figure 5
Figure 5
Anionic lipid binding assay using liposomes. (A) Schematic of the experiment and sensograms of liposome binding to bare streptavidin biosensors in the presence of Ca2+ (left sensogram) and streptavidin biosensors coated with N-terminally biotin-tagged Syt1 in the absence (middle sensogram) and presence (right sensogram) of Ca2+. We measured interactions between C2AB fragments of Syt3, Syt1, Syt1 Arg398Glu/Arg399Glu (Syt1-C2AB RR), and Syt1 Lys326Glu/Lys327Ala (Syt1-C2AB KK) with liposomes containing PC, PE, SM, cholesterol, and a single anionic lipid species {either PS, PtdIns, or various phosphorylated phosphatidylinositols [PtdIns3P, PtdIns4P, PtdIns5P, PtdIns(3,5)P2, PtdIns(4,5)P2, and PtdIns(3,4,5)P3] as indicated in the legend} at ratios similar to those observed in synaptic vesicles, (for the ratios of different lipids in liposomes, see Experimental Procedures and Table 1). The binding levels for the sensograms are in units of nanometers. Similar sensograms were observed for the Syt3-C2AB, Syt1-C2AB KK, and Syt1-C2AB RR fragments (not shown). The solid arrow indicates the time of the addition of liposomes. The dotted arrow indicates the time of the switch to liposome-free buffer. (B–E) Bars represent the mean amount of bound liposomes detected at the same time point for all lipid mixtures and normalized by the level of N-terminally biotin-tagged Syt1-C2AB, Syt1-C2AB KK, Syt1-C2AB RR, and Syt3-C2AB fragments, respectively, captured by streptavidin biosensors. The error bars represent standard deviations obtained from two or three experiments. Comparison of interaction of Syt1-C2AB (B) and Syt3-C2AB (C) with a panel of anionic lipids in the presence and absence of Ca2+. Comparison of the interaction of Syt1-C2AB and Syt1-C2AB KK and Syt1-C2AB RR mutants with the lipids in the absence (D) and presence (E) of Ca2+.

Similar articles

Cited by

References

    1. Perin M. S.; Brose N.; Jahn R.; Sudhof T. C. (1991) Domain structure of synaptotagmin (p65). J. Biol. Chem. 266, 623–629. - PubMed
    1. Han W.; Rhee J. S.; Maximov A.; Lao Y.; Mashimo T.; Rosenmund C.; Sudhof T. C. (2004) N-Glycosylation is essential for vesicular targeting of synaptotagmin 1. Neuron 41, 85–99. - PubMed
    1. Fukuda M. (2002) Vesicle-associated membrane protein-2/synaptobrevin binding to synaptotagmin I promotes O-glycosylation of synaptotagmin I. J. Biol. Chem. 277, 30351–30358. - PubMed
    1. Kanno E.; Fukuda M. (2008) Increased plasma membrane localization of O-glycosylation-deficient mutant of synaptotagmin I in PC12 cells. J. Neurosci. Res. 86, 1036–1043. - PubMed
    1. Veit M.; Sollner T. H.; Rothman J. E. (1996) Multiple palmitoylation of synaptotagmin and the t-SNARE SNAP-25. FEBS Lett. 385, 119–123. - PubMed

Publication types

MeSH terms

Substances