

Acute unilateral ischemic renal injury induces progressive renal inflammation, lipid accumulation, histone modification, and "end-stage" kidney disease
- PMID: 21921025
- PMCID: PMC3233867
- DOI: 10.1152/ajprenal.00431.2011
Acute unilateral ischemic renal injury induces progressive renal inflammation, lipid accumulation, histone modification, and "end-stage" kidney disease
Abstract
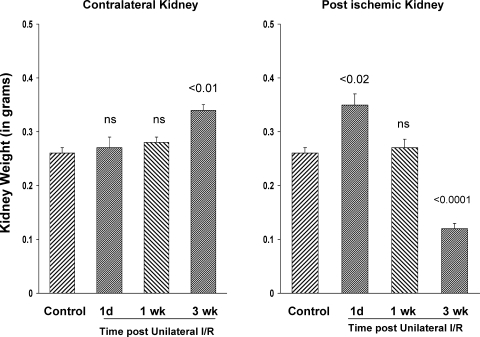
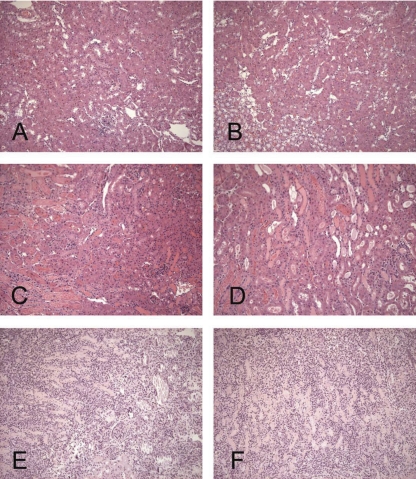
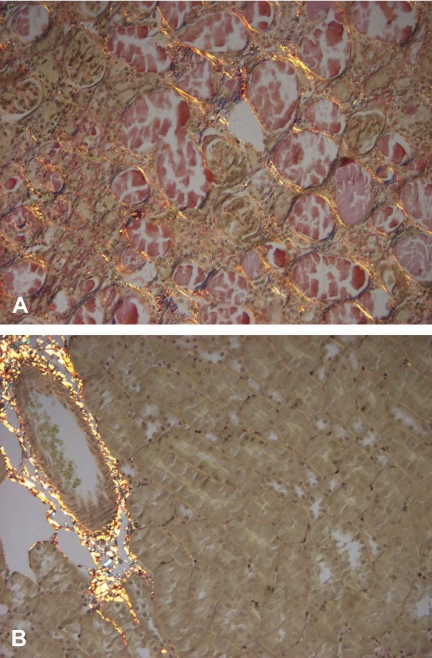
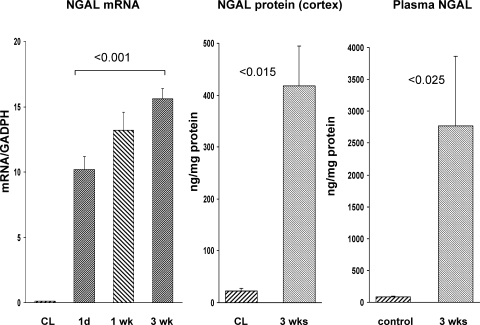
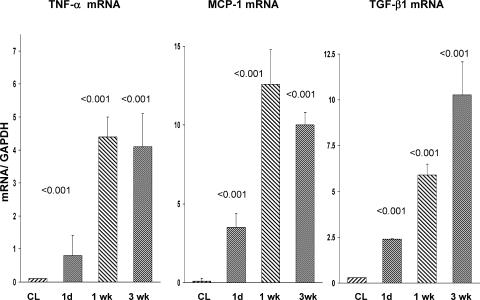
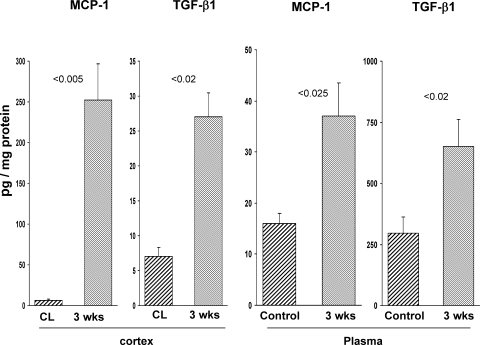
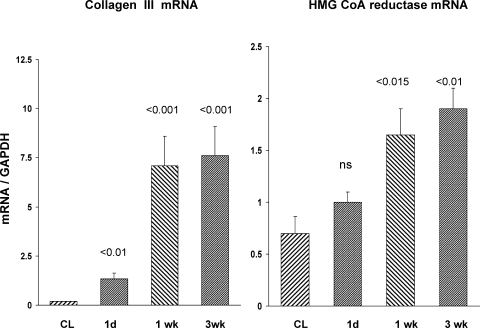
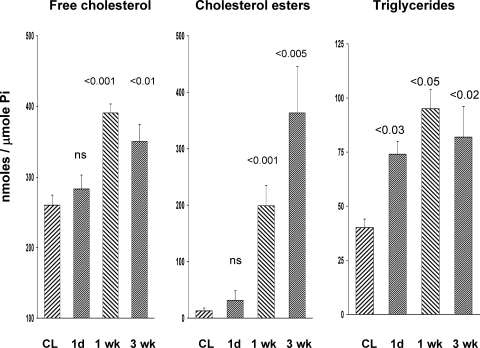
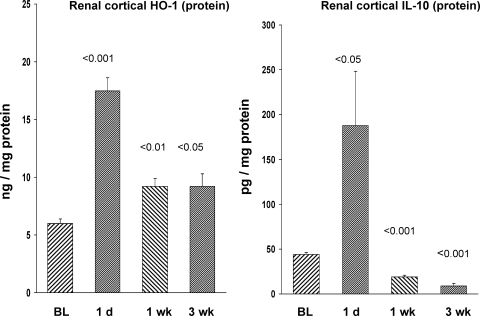
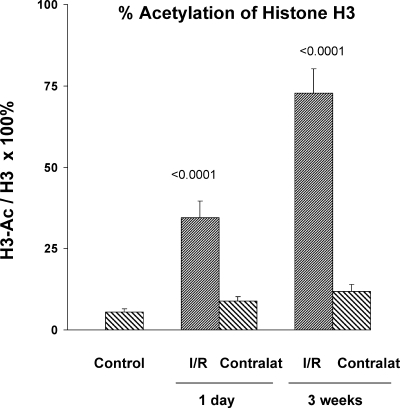
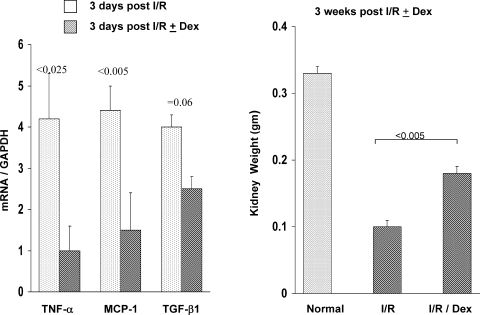
There is an emerging concept in clinical nephrology that acute kidney injury (AKI) can initiate chronic kidney disease (CKD). However, potential mechanisms by which this may occur remain elusive. Hence, this study tested the hypotheses that 1) AKI triggers progressive activation of selected proinflammatory genes, 2) there is a relative failure of compensatory anti-inflammatory gene expression, 3) proinflammatory lipid accumulation occurs, 4) these changes correspond with "gene-activating" histone acetylation, and 5) in concert, progressive renal disease results. CD-1 mice were subjected to 30 min of unilateral renal ischemia. Assessments were made 1 day, 1 wk, or 3 wk later. Results were contrasted to those observed in uninjured contralateral kidneys or in kidneys from normal mice. Progressive renal injury occurred throughout the 3-wk postischemic period, as denoted by stepwise increases in neutrophil gelatinase-associated lipocalin gene induction and ongoing histologic damage. By 3 wk postischemia, progressive renal disease was observed (massive tubular dropout; 2/3rds reduction in renal weight). These changes corresponded with progressive increases in proinflammatory cytokine/chemokine gene expression (MCP-1, TNF-α, TGF-β1), a relative failure of anti-inflammatory enzyme/cytokine (heme oxygenase-1; IL-10) upregulation, and progressive renal lipid (cholesterol/triglyceride) loading. Stepwise increases in collagen III mRNA and collagen deposition (Sirius red staining) indicated a progressive profibrotic response. Postischemic dexamethasone treatment significantly preserved renal mass, indicating functional significance of the observed proinflammatory state. Progressive gene-activating H3 acetylation was observed by ELISA, rising from 5% at baseline to 75% at 3 wk. This was confirmed by chromatin immunoprecipitation assay of target genes. In sum, these results provide experimental support for the clinical concept that AKI can trigger CKD, this is partially mediated by progressive postischemic inflammation, ongoing lipid accumulation results (potentially evoking "lipotoxicity"), and increasing histone acetylation at proinflammatory/profibrotic genes may contribute to this self-sustaining injury-promoting state.
Figures

Similar articles
-
Renal ischemia-reperfusion injury upregulates histone-modifying enzyme systems and alters histone expression at proinflammatory/profibrotic genes.Am J Physiol Renal Physiol. 2009 May;296(5):F1032-41. doi: 10.1152/ajprenal.00061.2009. Epub 2009 Mar 4. Am J Physiol Renal Physiol. 2009. PMID: 19261745 Free PMC article.
-
Acute hepatic ischemic-reperfusion injury induces a renal cortical "stress response," renal "cytoresistance," and an endotoxin hyperresponsive state.Am J Physiol Renal Physiol. 2014 Oct 1;307(7):F856-68. doi: 10.1152/ajprenal.00378.2014. Epub 2014 Jul 30. Am J Physiol Renal Physiol. 2014. PMID: 25080526 Free PMC article.
-
Progressive histone alterations and proinflammatory gene activation: consequences of heme protein/iron-mediated proximal tubule injury.Am J Physiol Renal Physiol. 2010 Mar;298(3):F827-37. doi: 10.1152/ajprenal.00683.2009. Epub 2009 Dec 23. Am J Physiol Renal Physiol. 2010. PMID: 20032114 Free PMC article.
-
Neutrophil gelatinase associated lipocalin in acute kidney injury.Postgrad Med. 2013 Nov;125(6):82-93. doi: 10.3810/pgm.2013.11.2715. Postgrad Med. 2013. PMID: 24200764 Review.
-
Neutrophil gelatinase-associated lipocalin: pathophysiology and clinical applications.Acta Physiol (Oxf). 2013 Apr;207(4):663-72. doi: 10.1111/apha.12054. Epub 2013 Feb 4. Acta Physiol (Oxf). 2013. PMID: 23375078 Free PMC article. Review.
Cited by
-
Protective Effect of Joa-Gui Em through the Improvement of the NLRP3 and TLR4/NF-κb Signaling by Ischemia/Reperfusion-Induced Acute Renal Failure Rats.Evid Based Complement Alternat Med. 2021 May 28;2021:7178868. doi: 10.1155/2021/7178868. eCollection 2021. Evid Based Complement Alternat Med. 2021. PMID: 34135984 Free PMC article.
-
Determinants of preferential renal accumulation of synthetic polymers in acute kidney injury.Int J Pharm. 2019 Sep 10;568:118555. doi: 10.1016/j.ijpharm.2019.118555. Epub 2019 Jul 22. Int J Pharm. 2019. PMID: 31344445 Free PMC article.
-
Short-term dexamethasone treatment transiently, but not permanently, attenuates fibrosis after acute-to-chronic kidney injury.BMC Nephrol. 2018 Dec 3;19(1):343. doi: 10.1186/s12882-018-1151-7. BMC Nephrol. 2018. PMID: 30509215 Free PMC article.
-
Lead exposure induces dysregulation of constitutive heterochromatin hallmarks in live cells.Curr Res Toxicol. 2021 Dec 11;3:100061. doi: 10.1016/j.crtox.2021.12.001. eCollection 2022. Curr Res Toxicol. 2021. PMID: 35005634 Free PMC article.
-
Renal denervation prevents long-term sequelae of ischemic renal injury.Kidney Int. 2015 Feb;87(2):350-8. doi: 10.1038/ki.2014.300. Epub 2014 Sep 10. Kidney Int. 2015. PMID: 25207878 Free PMC article.
References
-
- Adcock IM, Ito K, Barnes PJ. Histone deacetylation: an important mechanism in inflammatory lung diseases (Review). COPD 2: 445–455, 2005 - PubMed
-
- Bonventre JV. Pathophysiology of acute kidney injury: roles of potential inhibitors of inflammation (Review). Contrib Nephrol 156: 39–46, 2007 - PubMed
-
- Chen F, Smith R, Gu YZ, Collins ND, Nioi P. Toxicoepigenetic alteration of the kidney injury molecule 1 gene in gentamicin-exposed rat kidney. Toxicol Sci 117: 375–380, 2010 - PubMed
-
- Christo JS, Rodrigues AM, Mouro MG, Cenedeze MA, Simoes MJ, Schor N, Higa EM. Nitric oxide (NO) is associated with gentamicin (GENTA) nephrotoxicity and the renal function recovery after suspension of GENTA treatment in rats. Nitric Oxide 24: 77–83, 2011 - PubMed
Publication types
MeSH terms
Substances
Grants and funding
LinkOut - more resources
Full Text Sources
Other Literature Sources
Medical
Miscellaneous