High fragmentation characterizes tumour-derived circulating DNA
- PMID: 21909401
- PMCID: PMC3167805
- DOI: 10.1371/journal.pone.0023418
High fragmentation characterizes tumour-derived circulating DNA
Abstract
Background: Circulating DNA (ctDNA) is acknowledged as a potential diagnostic tool for various cancers including colorectal cancer, especially when considering the detection of mutations. Certainly due to lack of normalization of the experimental conditions, previous reports present many discrepancies and contradictory data on the analysis of the concentration of total ctDNA and on the proportion of tumour-derived ctDNA fragments.
Methodology: In order to rigorously analyse ctDNA, we thoroughly investigated ctDNA size distribution. We used a highly specific Q-PCR assay and athymic nude mice xenografted with SW620 or HT29 human colon cancer cells, and we correlated our results by examining plasma from metastatic CRC patients.
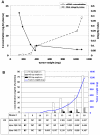
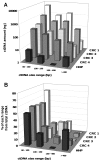
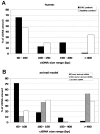
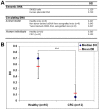
Conclusion/significance: Fragmentation and concentration of tumour-derived ctDNA is positively correlated with tumour weight. CtDNA quantification by Q-PCR depends on the amplified target length and is optimal for 60-100 bp fragments. Q-PCR analysis of plasma samples from xenografted mice and cancer patients showed that tumour-derived ctDNA exhibits a specific amount profile based on ctDNA size and significant higher ctDNA fragmentation. Metastatic colorectal patients (n = 12) showed nearly 5-fold higher mean ctDNA fragmentation than healthy individuals (n = 16).
Conflict of interest statement
Figures


Similar articles
-
Origin and quantification of circulating DNA in mice with human colorectal cancer xenografts.Nucleic Acids Res. 2010 Oct;38(18):6159-75. doi: 10.1093/nar/gkq421. Epub 2010 May 21. Nucleic Acids Res. 2010. PMID: 20494973 Free PMC article.
-
Individualized Mutation Detection in Circulating Tumor DNA for Monitoring Colorectal Tumor Burden Using a Cancer-Associated Gene Sequencing Panel.PLoS One. 2016 Jan 4;11(1):e0146275. doi: 10.1371/journal.pone.0146275. eCollection 2016. PLoS One. 2016. PMID: 26727500 Free PMC article. Clinical Trial.
-
Multi-marker analysis of circulating cell-free DNA toward personalized medicine for colorectal cancer.Mol Oncol. 2014 Jul;8(5):927-41. doi: 10.1016/j.molonc.2014.02.005. Epub 2014 Mar 24. Mol Oncol. 2014. PMID: 24698732 Free PMC article.
-
The importance of examining the proportion of circulating DNA originating from tumor, microenvironment and normal cells in colorectal cancer patients.Expert Opin Biol Ther. 2012 Jun;12 Suppl 1:S209-15. doi: 10.1517/14712598.2012.688023. Epub 2012 May 18. Expert Opin Biol Ther. 2012. PMID: 22594497 Review.
-
[Liquid biopsy in colorectal cancer : An overview of ctDNA analysis in tumour diagnostics].Pathologe. 2019 Dec;40(Suppl 3):244-251. doi: 10.1007/s00292-019-00698-3. Pathologe. 2019. PMID: 31797045 Review. German.
Cited by
-
Analytical Technologies for Liquid Biopsy of Subcellular Materials.Annu Rev Anal Chem (Palo Alto Calif). 2021 Jul 27;14(1):207-229. doi: 10.1146/annurev-anchem-091520-093931. Annu Rev Anal Chem (Palo Alto Calif). 2021. PMID: 33974805 Free PMC article.
-
[Research Progress of Circulating Tumor DNA in Non-small Cell Lung Cancer].Zhongguo Fei Ai Za Zhi. 2022 Sep 20;25(9):665-670. doi: 10.3779/j.issn.1009-3419.2022.102.35. Zhongguo Fei Ai Za Zhi. 2022. PMID: 36172731 Free PMC article. Chinese.
-
Tumor DNA as a Cancer Biomarker through the Lens of Colorectal Neoplasia.Cancer Epidemiol Biomarkers Prev. 2020 Dec;29(12):2441-2453. doi: 10.1158/1055-9965.EPI-20-0549. Epub 2020 Oct 8. Cancer Epidemiol Biomarkers Prev. 2020. PMID: 33033144 Free PMC article.
-
DNA in extracellular vesicles: from evolution to its current application in health and disease.Cell Biosci. 2022 Mar 28;12(1):37. doi: 10.1186/s13578-022-00771-0. Cell Biosci. 2022. PMID: 35346363 Free PMC article. Review.
-
New insights into structural features and optimal detection of circulating tumor DNA determined by single-strand DNA analysis.NPJ Genom Med. 2018 Nov 23;3:31. doi: 10.1038/s41525-018-0069-0. eCollection 2018. NPJ Genom Med. 2018. PMID: 30479833 Free PMC article.
References
-
- Sawyers CL. The cancer biomarker problem. Nature. 2008;452:548–552. - PubMed
-
- Gormally E, Hainaut P, Caboux E, Airoldi L, Autrup H, et al. Amount of DNA in plasma and cancer risk: a prospective study. Int J Cancer. 2004;111:746–749. - PubMed
-
- Fleischhacker M, Schmidt B. Circulating nucleic acids (CNAs) and cancer—a survey. Biochim Biophys Acta. 2007;1775:181–232. - PubMed
-
- Frattini M, Gallino G, Signoroni S, Balestra D, Lusa L, et al. Quantitative and qualitative characterization of plasma DNA identifies primary and recurrent colorectal cancer. Cancer Lett. 2008;263:170–181. - PubMed
Publication types
MeSH terms
Substances
LinkOut - more resources
Full Text Sources
Other Literature Sources
Medical

