Chemical inhibition of RNA viruses reveals REDD1 as a host defense factor
- PMID: 21909097
- PMCID: PMC3329801
- DOI: 10.1038/nchembio.645
Chemical inhibition of RNA viruses reveals REDD1 as a host defense factor
Abstract
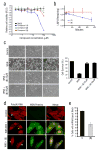
A chemical genetics approach was taken to identify inhibitors of NS1, a major influenza A virus virulence factor that inhibits host gene expression. A high-throughput screen of 200,000 synthetic compounds identified small molecules that reversed NS1-mediated inhibition of host gene expression. A counterscreen for suppression of influenza virus cytotoxicity identified naphthalimides that inhibited replication of influenza virus and vesicular stomatitis virus (VSV). The mechanism of action occurs through activation of REDD1 expression and concomitant inhibition of mammalian target of rapamycin complex 1 (mTORC1) via TSC1-TSC2 complex. The antiviral activity of naphthalimides was abolished in REDD1(-/-) cells. Inhibition of REDD1 expression by viruses resulted in activation of the mTORC1 pathway. REDD1(-/-) cells prematurely upregulated viral proteins via mTORC1 activation and were permissive to virus replication. In contrast, cells conditionally expressing high concentrations of REDD1 downregulated the amount of viral protein. Thus, REDD1 is a new host defense factor, and chemical activation of REDD1 expression represents a potent antiviral intervention strategy.
Conflict of interest statement
Authors declare no competing financial interest.
Figures


Similar articles
-
APOBEC3G-Regulated Host Factors Interfere with Measles Virus Replication: Role of REDD1 and Mammalian TORC1 Inhibition.J Virol. 2018 Aug 16;92(17):e00835-18. doi: 10.1128/JVI.00835-18. Print 2018 Sep 1. J Virol. 2018. PMID: 29925665 Free PMC article.
-
Novel inhibitor of influenza non-structural protein 1 blocks multi-cycle replication in an RNase L-dependent manner.J Gen Virol. 2011 Jan;92(Pt 1):60-70. doi: 10.1099/vir.0.025015-0. Epub 2010 Sep 29. J Gen Virol. 2011. PMID: 20881091 Free PMC article.
-
Identification of BPR3P0128 as an inhibitor of cap-snatching activities of influenza virus.Antimicrob Agents Chemother. 2012 Feb;56(2):647-57. doi: 10.1128/AAC.00125-11. Epub 2011 Sep 19. Antimicrob Agents Chemother. 2012. PMID: 21930871 Free PMC article.
-
Structure and Activities of the NS1 Influenza Protein and Progress in the Development of Small-Molecule Drugs.Int J Mol Sci. 2021 Apr 19;22(8):4242. doi: 10.3390/ijms22084242. Int J Mol Sci. 2021. PMID: 33921888 Free PMC article. Review.
-
Structure and Function of the Influenza A Virus Non-Structural Protein 1.J Microbiol Biotechnol. 2019 Aug 28;29(8):1184-1192. doi: 10.4014/jmb.1903.03053. J Microbiol Biotechnol. 2019. PMID: 31154753 Review.
Cited by
-
A Review and Meta-Analysis of Influenza Interactome Studies.Front Microbiol. 2022 Apr 21;13:869406. doi: 10.3389/fmicb.2022.869406. eCollection 2022. Front Microbiol. 2022. PMID: 35531276 Free PMC article. Review.
-
Nitric-oxide enriched plasma-activated water inactivates 229E coronavirus and alters antiviral response genes in human lung host cells.Bioact Mater. 2023 Jan;19:569-580. doi: 10.1016/j.bioactmat.2022.05.005. Epub 2022 May 8. Bioact Mater. 2023. PMID: 35574062 Free PMC article.
-
Identification of Host Kinase Genes Required for Influenza Virus Replication and the Regulatory Role of MicroRNAs.PLoS One. 2013 Jun 21;8(6):e66796. doi: 10.1371/journal.pone.0066796. Print 2013. PLoS One. 2013. PMID: 23805279 Free PMC article.
-
APOBEC3G-Regulated Host Factors Interfere with Measles Virus Replication: Role of REDD1 and Mammalian TORC1 Inhibition.J Virol. 2018 Aug 16;92(17):e00835-18. doi: 10.1128/JVI.00835-18. Print 2018 Sep 1. J Virol. 2018. PMID: 29925665 Free PMC article.
-
Influenza A Virus NS1 Protein Promotes Efficient Nuclear Export of Unspliced Viral M1 mRNA.J Virol. 2017 Jul 12;91(15):e00528-17. doi: 10.1128/JVI.00528-17. Print 2017 Aug 1. J Virol. 2017. PMID: 28515301 Free PMC article.
References
Publication types
MeSH terms
Substances
Associated data
Grants and funding
- C06 RR015437/RR/NCRR NIH HHS/United States
- R01 AI089539/AI/NIAID NIH HHS/United States
- U54AI057158/AI/NIAID NIH HHS/United States
- R01 AI079110-03/AI/NIAID NIH HHS/United States
- U01AI074539/AI/NIAID NIH HHS/United States
- R01 GM067159/GM/NIGMS NIH HHS/United States
- U54 AI057158/AI/NIAID NIH HHS/United States
- R01 CA071443/CA/NCI NIH HHS/United States
- R01 AI079110/AI/NIAID NIH HHS/United States
- R01GM07159/GM/NIGMS NIH HHS/United States
- P01AI058113/AI/NIAID NIH HHS/United States
- R01GM06715908S1/GM/NIGMS NIH HHS/United States
- R01 AI046954/AI/NIAID NIH HHS/United States
- R01CA129387/CA/NCI NIH HHS/United States
- R01 CA071443-15/CA/NCI NIH HHS/United States
- U01 AI074539/AI/NIAID NIH HHS/United States
- R01 CA129387/CA/NCI NIH HHS/United States
- R01AI046954/AI/NIAID NIH HHS/United States
- C06-RR15437/RR/NCRR NIH HHS/United States
- R01AI089539/AI/NIAID NIH HHS/United States
- R01 GM067159-10/GM/NIGMS NIH HHS/United States
- R01AI079110/AI/NIAID NIH HHS/United States
- R01 CA071443-16/CA/NCI NIH HHS/United States
- R01 AI089539-03/AI/NIAID NIH HHS/United States
- HHSN266200700010C/AI/NIAID NIH HHS/United States
- P01 AI058113/AI/NIAID NIH HHS/United States
LinkOut - more resources
Full Text Sources
Other Literature Sources
Molecular Biology Databases

