. 2011 Nov;22(21):4047-58.
doi: 10.1091/mbc.E11-06-0582. Epub 2011 Sep 7.

β-Actin specifically controls cell growth, migration, and the G-actin pool

Affiliations

β-Actin specifically controls cell growth, migration, and the G-actin pool

Tina M Bunnell et al. Mol Biol Cell. 2011 Nov.

Abstract

Ubiquitously expressed β-actin and γ-actin isoforms play critical roles in most cellular processes; however, their unique contributions are not well understood. We generated whole-body β-actin-knockout (Actb(-/-)) mice and demonstrated that β-actin is required for early embryonic development. Lethality of Actb(-/-) embryos correlated with severe growth impairment and migration defects in β-actin-knockout primary mouse embryonic fibroblasts (MEFs) that were not observed in γ-actin-null MEFs. Migration defects were associated with reduced membrane protrusion dynamics and increased focal adhesions. We also identified migration defects upon conditional ablation of β-actin in highly motile T cells. Of great interest, ablation of β-actin altered the ratio of globular actin (G-actin) to filamentous actin in MEFs, with corresponding changes in expression of genes that regulate the cell cycle and motility. These data support an essential role for β-actin in regulating cell migration and gene expression through control of the cellular G-actin pool.


Figures

FIGURE 1:
FIGURE 1:
In vivo characterization of β-actin deficiency. (A) Representative immunoblots of SDS extracts from Actb+/+ and Actb+/− adult brain and kidney tissue probed with antibodies specific for β-actin, γ-actin, αsm-actin, or pan-actin. (B) Protein levels were quantified from brain, liver, kidney, and lung tissues from three separate experiments blotted in triplicate using the LI-COR Odyssey imaging system. Bar graphs represent relative expression levels in Actb+/− tissues as compared with Actb+/+ levels (mean ± SEM). (C) Kaplan–Meier survival curve of Actb+/+ and Actb+/− mice from 0 to 320 d of age. Tick marks represent censored animals. Survival curves are significantly different (p < 0.0001, log-rank test; n ≥ 62 for each genotype). (D) Representative images of E7.5 Actb+/+ and Actb−/− embryos. Scale bar, 200 μm.
FIGURE 2:
FIGURE 2:
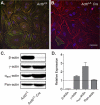
Efficient knockout of β-actin in MEFs. (A, B) Representa­tive images of ActbL/L (A) and ActbL/L Cre (B) MEFs cultured overnight and costained with antibodies to β-actin (green) and γ-actin (red). Scale bar, 50 μm. (C) Representative immunoblots of cell lysates from ActbL/L and ActbL/L Cre MEFs probed with pan actin or actin isoform–specific antibodies. (D) Relative expression levels in ActbL/L Cre cells as compared with ActbL/L cells using quantitative Western blot analysis (n = 5; mean ± SEM).
FIGURE 3:
FIGURE 3:
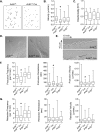
Severe growth deficiency in the absence of β-actin. (A) Growth curves of ActbL/L and ActbL/L Cre MEFs (n = 4). Cell numbers were significantly decreased in ActbL/L Cre MEFs from day 2 onward as determined by an unpaired t test at each time point. (B) Dot plots from FITC-annexin V flow cytometric analyses. Lower right box, early apoptotic cells; upper right, dead cells. (C) Mean percentage of apoptotic cells, defined as FITC positive and propidium iodide negative (n = 4). (D) Mean percentage of cells containing multiple nuclei from at least three or four independent experiments. More than 250 cells were counted per experiment. (E) Representative traces from flow cytometric analyses of DNA content by propidium iodide staining. Asterisks denote significant differences (p < 0.05); error bars, SEM.
FIGURE 4:
FIGURE 4:
Impaired migration in β-actin–knockout MEFs. (A) Randomly migrating cells were tracked at 10-min intervals for 4 h. Representative examples of individual migration tracks of ActbL/L and ActbL/L Cre MEFs combined into a single figure. (B) Quantification of migration velocity (n ≥ 88 cells per genotype). (C) Directionality of cell migration was calculated as the linear distance (D) over the total track distance (T) of a cell. (D, E) Individual frames (D) and kymographs (E) from DIC time-lapse movies of ActbL/L and ActbL/L Cre MEFs. Kymographs show lamellipodial activity along the lines in respective DIC images. Images in D represent the last frame of the 10-min movie. Line, 10 μm. (F, G) Quantification of kymographs showing the frequency, persistence, and velocity of protrusion (F) and retraction (G) events. For all box and whisker plots, whiskers indicate maximum and minimum values, the box represents the 25–75th quartile, and the line indicates the median. Asterisks denote significant differences (p < 0.05) from all other genotypes.
FIGURE 5:
FIGURE 5:
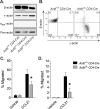
Conditional β-actin knockout in CD4-positive T cells leads to impaired migration. (A) Immunoblots of lysates from unfractionated thymocytes probed with pan-actin or actin isoform–specific antibodies. (B) Dot plots from flow cytometric analysis of CD4sp/TCRβhi T cells colabeled with β-actin and γ-actin isoform–specific antibodies showing decreased β-actin expression and increased γ-actin expression in ActbL/L CD4-Cre cells. (C, D) The number of CD4sp/TCRβhi cells migrating through 5-μm-pore (C) or 3-μm-pore (D) transwell filters toward CCL21 as quantified by flow cytometry. Data are expressed as percentage input and reflect an average (± SEM) from three independent experiments, with triplicate values recorded and averaged for each experiment. Asterisks denote significant difference from control cells (p < 0.05).
FIGURE 6:
FIGURE 6:
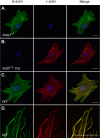
β-Actin and γ-actin colocalize in wild-type MEFs. (A–D) Cells were sparsely plated on fibronectin, incubated for 3 h and subsequently costained with antibodies to β-actin (green) and γ-actin (red). Actg1−/− (A) and ActbL/L Cre (B) cells demonstrate the isoform specificity of γ-actin and β-actin antibodies, respectively. In wild-type (WT) cells (C), all actin structures were colabeled with β-actin and γ-actin antibodies. High magnification of membrane protrusions (D) demonstrates colocalization of β-actin and γ-actin in lamellipodia. Cells were maintained in 10% serum. Scale bars, 20 μm.
FIGURE 7:
FIGURE 7:
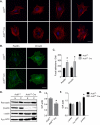
Increased focal adhesion formation and F-actin content in β-actin–knockout MEFs. (A) Phalloidin-stained MEFs showing increased stress fibers in ActbL/L Cre cells. (B) Representative images of MEFs labeled with paxillin or vinculin antibodies. (C) Quantification of focal adhesions per cell using integrated morphometry analysis from paxillin- and vinculin-stained images (n ≥ 7 cells per antibody). (D) Immunoblots probed with pan-actin or actin isoform–specific antibodies of supernatant (S) and pellet (P) fractions from cell lysates after high-speed centrifugation. G-actin and F-actin pools are found in the supernatant and pellet fractions, respectively. (E, F) Quantitative Western blot results of ratios of G- to F-actin from immunoblots labeled with a pan-actin antibody (E) or actin isoform–specific antibodies (F) (n = 7, mean ± SEM). Asterisks denote significant differences (p < 0.05). Scale bars, 30 μm.

Similar articles

Cited by

References

    1. Bassell GJ, Zhang H, Byrd AL, Femino AM, Singer RH, Taneja KL, Lifshitz LM, Herman IM, Kosik KS. Sorting of beta-actin mRNA and protein to neurites and growth cones in culture. J Neurosci. 1998;18:251–265. - PMC - PubMed
    1. Belyantseva IA, et al. Gamma-actin is required for cytoskeletal maintenance but not development. Proc Natl Acad Sci USA. 2009;106:9703–9708. - PMC - PubMed
    1. Bergeron SE, Zhu M, Thiem SM, Friderici KH, Rubenstein PA. Ion-dependent polymerization differences between mammalian beta- and gamma-nonmuscle actin isoforms. J Biol Chem. 2010;285:16087–16095. - PMC - PubMed
    1. Bunnell TM, Ervasti JM. Delayed embryonic development and impaired cell growth and survival in Actg1 null mice. Cytoskeleton (Hoboken) 2010;67:564–572. - PMC - PubMed
    1. Dugina V, Zwaenepoel I, Gabbiani G, Clement S, Chaponnier C. Beta and gamma-cytoplasmic actins display distinct distribution and functional diversity. J Cell Sci. 2009;122:2980–2988. - PubMed

Publication types

MeSH terms

LinkOut - more resources