

miR-31 is a broad regulator of β1-integrin expression and function in cancer cells
- PMID: 21875932
- PMCID: PMC3219821
- DOI: 10.1158/1541-7786.MCR-11-0311
miR-31 is a broad regulator of β1-integrin expression and function in cancer cells
Abstract
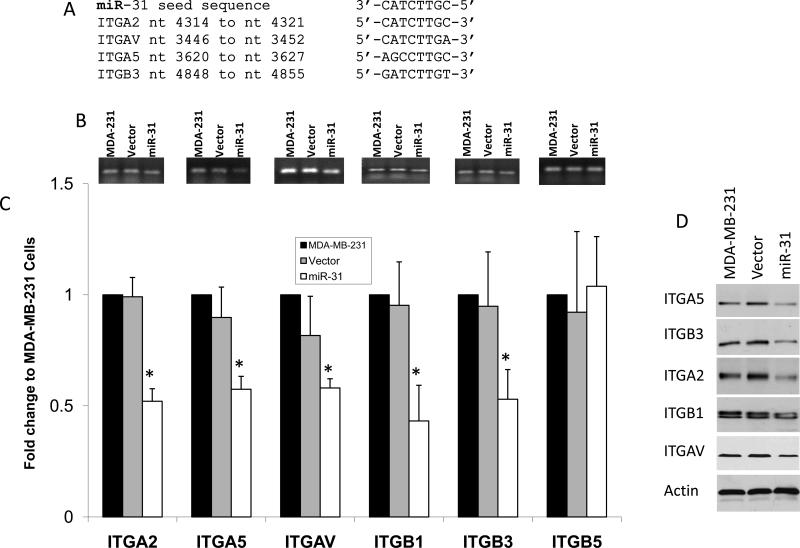
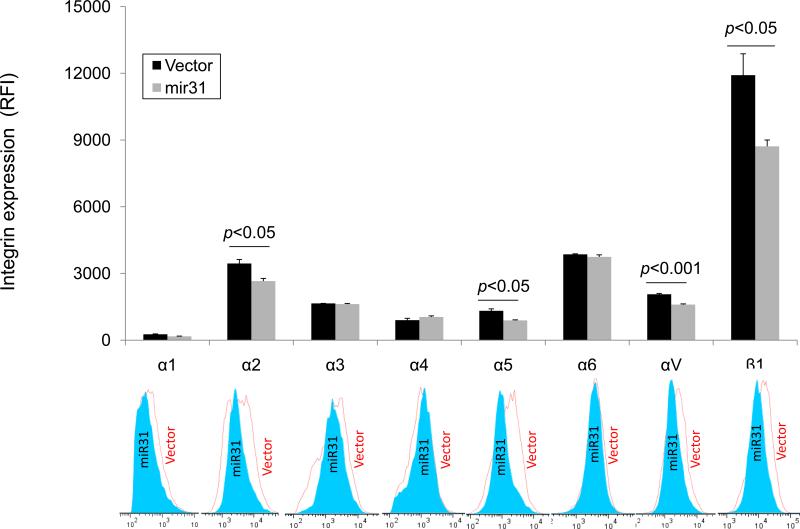
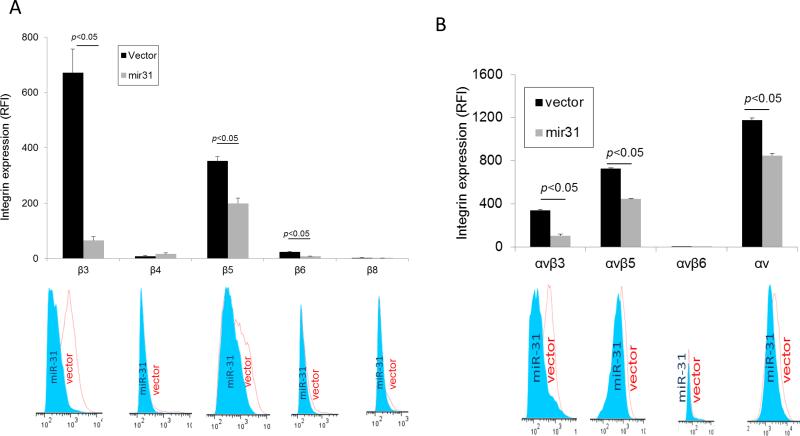
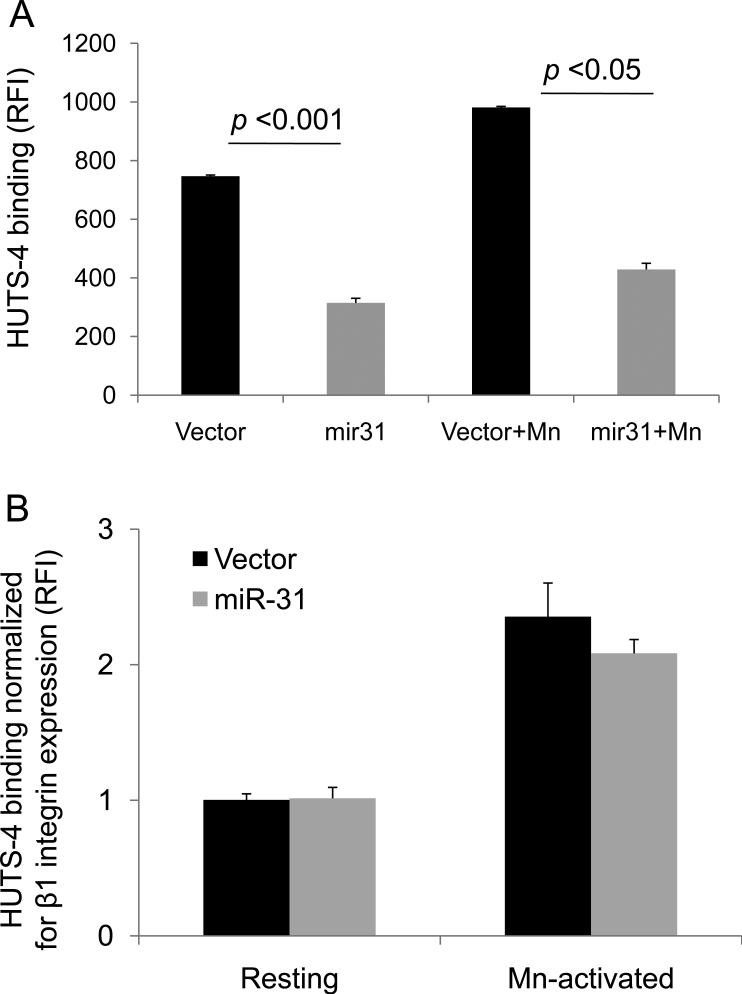
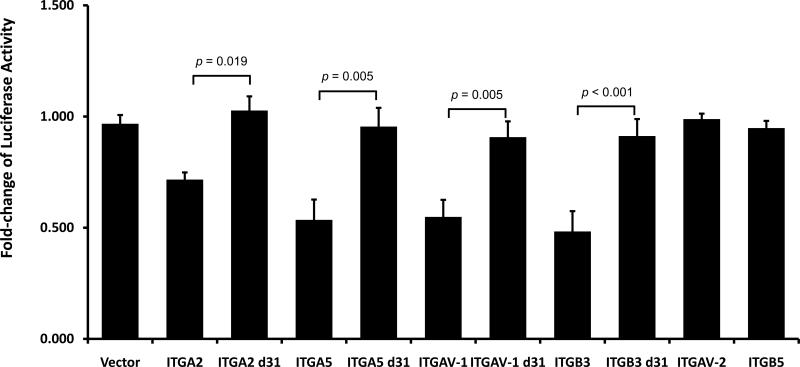
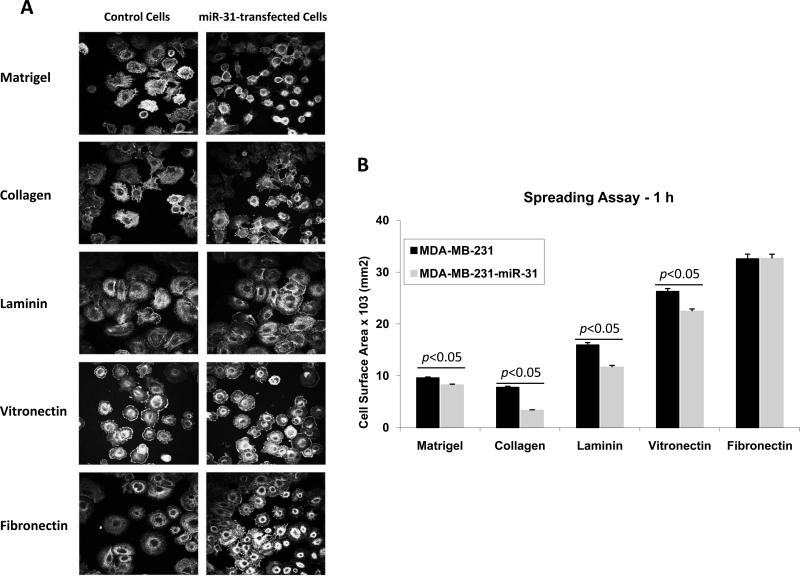
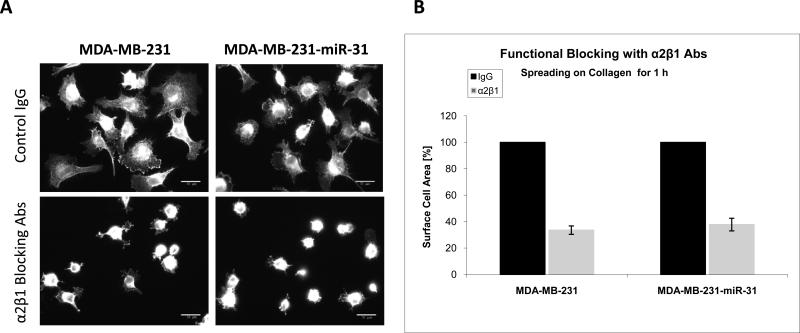
Integrins are adhesion receptors involved in bidirectional signaling that are crucial for various cellular responses during normal homeostasis and pathologic conditions such as cancer progression and metastasis. Aberrant expression of noncoding microRNAs (miRNA) has been implicated in the deregulation of integrin expression and activity, leading to the development and progression of cancer tumors, including their acquisition of the metastatic phenotype. miR-31 is a key regulator of several critical genes involved in the invasion-metastasis cascade in cancer. Using diverse cell-based, genetic, biochemical, flow cytometry, and functional analyses, we report that miR-31 is a master regulator of integrins as it targets multiple α subunit partners (α2, α5, and αV) of β1 integrins and also β3 integrins. We found that expression of miR-31 in cancer cells resulted in a significant repression of these integrin subunits both at the mRNA and protein levels. Loss of expression of α2, α5, αV, and β3 was a direct consequence of miR-31 targeting conserved seed sequences in the 3' untranslated region of these integrin subunits leading to their posttranscriptional repression, which was reflected in their diminished surface expression in live cells. The biological consequence of decreased the cell surface of these integrins was a significant inhibition of cell spreading in a ligand-dependent manner. Although different reports have shown that a single integrin can be regulated by several miRNAs, here we show that a single miRNA, miR-31, is able to specifically target several integrin subunits to regulate key aspects of cancer cell invasion and metastasis.
Mol Cancer Res; 9(11); 1500-8. ©2011 AACR.
Figures
Similar articles
-
Downregulation of β3 integrin by miR-30a-5p modulates cell adhesion and invasion by interrupting Erk/Ets‑1 network in triple-negative breast cancer.Int J Oncol. 2016 Mar;48(3):1155-64. doi: 10.3892/ijo.2016.3319. Epub 2016 Jan 5. Int J Oncol. 2016. PMID: 26781040
-
miR-199a-5p regulates β1 integrin through Ets-1 to suppress invasion in breast cancer.Cancer Sci. 2016 Jul;107(7):916-23. doi: 10.1111/cas.12952. Epub 2016 Jun 13. Cancer Sci. 2016. PMID: 27094578 Free PMC article.
-
Targeting of integrin beta1 and kinesin 2alpha by microRNA 183.J Biol Chem. 2010 Feb 19;285(8):5461-71. doi: 10.1074/jbc.M109.037127. Epub 2009 Nov 24. J Biol Chem. 2010. PMID: 19940135 Free PMC article.
-
β1-integrins signaling and mammary tumor progression in transgenic mouse models: implications for human breast cancer.Breast Cancer Res. 2011;13(6):229. doi: 10.1186/bcr2905. Epub 2011 Nov 30. Breast Cancer Res. 2011. PMID: 22264244 Free PMC article. Review.
-
The characteristics and the multiple functions of integrin β1 in human cancers.J Transl Med. 2023 Nov 6;21(1):787. doi: 10.1186/s12967-023-04696-1. J Transl Med. 2023. PMID: 37932738 Free PMC article. Review.
Cited by
-
miR-31 and its host gene lncRNA LOC554202 are regulated by promoter hypermethylation in triple-negative breast cancer.Mol Cancer. 2012 Jan 30;11:5. doi: 10.1186/1476-4598-11-5. Mol Cancer. 2012. PMID: 22289355 Free PMC article.
-
MicroRNA-31 sensitizes human breast cells to apoptosis by direct targeting of protein kinase C epsilon (PKCepsilon).J Biol Chem. 2013 Mar 22;288(12):8750-8761. doi: 10.1074/jbc.M112.414128. Epub 2013 Jan 30. J Biol Chem. 2013. PMID: 23364795 Free PMC article.
-
Evidence for microRNA-31 dependent Bim-Bax interaction preceding mitochondrial Bax translocation during radiation-induced apoptosis.Sci Rep. 2015 Oct 30;5:15923. doi: 10.1038/srep15923. Sci Rep. 2015. PMID: 26514984 Free PMC article.
-
The Emerging Role of miRNAs in HTLV-1 Infection and ATLL Pathogenesis.Viruses. 2015 Jul 20;7(7):4047-74. doi: 10.3390/v7072805. Viruses. 2015. PMID: 26205403 Free PMC article. Review.
-
In silico analysis of pathways affected by differentially expressed microRNA in adrenocortical tumors.J Endocrinol Invest. 2013 Dec;36(11):1011-9. doi: 10.3275/9024. Epub 2013 Jul 1. J Endocrinol Invest. 2013. PMID: 23812403
References
-
- Johnson MS, Lu N, Denessiouk K, Heino J, Gullberg D. Integrins during evolution: evolutionary trees and model organisms. Biochim Biophys Acta. 2009 April;1788(4):779–89. - PubMed
-
- Cavallaro U, Dejana E. Adhesion molecule signalling: not always a sticky business. Nat Rev Mol Cell Biol. 2011 March;12(3):189–97. - PubMed
Publication types
MeSH terms
Substances
Grants and funding
LinkOut - more resources
Full Text Sources
Other Literature Sources
Medical
