Inhibitory Fcγ receptor engagement drives adjuvant and anti-tumor activities of agonistic CD40 antibodies
- PMID: 21852502
- PMCID: PMC3164589
- DOI: 10.1126/science.1206954
Inhibitory Fcγ receptor engagement drives adjuvant and anti-tumor activities of agonistic CD40 antibodies
Abstract
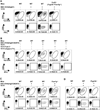
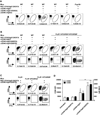
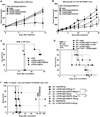
CD40, a member of the tumor necrosis factor receptor (TNFR) superfamily, is expressed on antigen-presenting cells (APCs) and is essential for immune activation. Although agonistic CD40 antibodies have been developed for immunotherapy, their clinical efficacy has been limited. We have found that coengagement of the Fc domain of agonistic CD40 monoclonal antibodies (mAbs) with the inhibitory Fcγ receptor FcγRIIB is required for immune activation. Direct comparison of mAbs to CD40 enhanced for activating FcγR binding, hence capable of cytotoxicity, or for inhibitory FcγRIIB binding, revealed that enhancing FcγRIIB binding conferred immunostimulatory activity and considerably greater anti-tumor responses. This unexpected requirement for FcγRIIB in enhancing CD40-mediated immune activation has direct implications for the design of agonistic antibodies to TNFR as therapeutics.
Figures


Comment in
-
Immunology. The adjuvant effects of antibodies.Science. 2011 Aug 19;333(6045):944-5. doi: 10.1126/science.1210801. Science. 2011. PMID: 21852479 No abstract available.
Similar articles
-
Fcγ receptor dependency of agonistic CD40 antibody in lymphoma therapy can be overcome through antibody multimerization.J Immunol. 2014 Aug 15;193(4):1828-35. doi: 10.4049/jimmunol.1303204. Epub 2014 Jul 14. J Immunol. 2014. PMID: 25024386
-
Role of crosslinking for agonistic CD40 monoclonal antibodies as immune therapy of cancer.Cancer Immunol Res. 2014 Jan;2(1):19-26. doi: 10.1158/2326-6066.CIR-13-0152. Cancer Immunol Res. 2014. PMID: 24416732 Free PMC article.
-
FcγRΙΙB controls the potency of agonistic anti-TNFR mAbs.Cancer Immunol Immunother. 2013 May;62(5):941-8. doi: 10.1007/s00262-013-1398-6. Epub 2013 Mar 31. Cancer Immunol Immunother. 2013. PMID: 23543215 Free PMC article. Review.
-
Therapeutic Activity of Agonistic, Human Anti-CD40 Monoclonal Antibodies Requires Selective FcγR Engagement.Cancer Cell. 2016 Jun 13;29(6):820-831. doi: 10.1016/j.ccell.2016.05.001. Epub 2016 Jun 2. Cancer Cell. 2016. PMID: 27265505 Free PMC article.
-
Fc gamma receptors and cancer.Springer Semin Immunopathol. 2006 Dec;28(4):321-8. doi: 10.1007/s00281-006-0058-8. Epub 2006 Nov 10. Springer Semin Immunopathol. 2006. PMID: 17096153 Review.
Cited by
-
HIF1α epigenetically repressed macrophages via CRISPR/Cas9-EZH2 system for enhanced cancer immunotherapy.Bioact Mater. 2021 Feb 20;6(9):2870-2880. doi: 10.1016/j.bioactmat.2021.02.008. eCollection 2021 Sep. Bioact Mater. 2021. PMID: 33718668 Free PMC article.
-
The role of myeloid cells in cancer therapies.Nat Rev Cancer. 2016 Jul;16(7):447-62. doi: 10.1038/nrc.2016.54. Nat Rev Cancer. 2016. PMID: 27339708 Review.
-
Agonist Antibodies for Cancer Immunotherapy: History, Hopes, and Challenges.Clin Cancer Res. 2024 May 1;30(9):1712-1723. doi: 10.1158/1078-0432.CCR-23-1014. Clin Cancer Res. 2024. PMID: 38153346 Free PMC article. Review.
-
Translating basic mechanisms of IgG effector activity into next generation cancer therapies.Cancer Immun. 2012;12:13. Epub 2012 May 1. Cancer Immun. 2012. PMID: 22896758 Free PMC article. Review.
-
A general requirement for FcγRIIB co-engagement of agonistic anti-TNFR antibodies.Cell Cycle. 2012 Sep 15;11(18):3343-4. doi: 10.4161/cc.21842. Epub 2012 Aug 23. Cell Cycle. 2012. PMID: 22918247 Free PMC article.
References
Publication types
MeSH terms
Substances
Grants and funding
LinkOut - more resources
Full Text Sources
Other Literature Sources
Molecular Biology Databases
Research Materials
Miscellaneous

