

Dysfunctional γδ T cells contribute to impaired keratinocyte homeostasis in mouse models of obesity
- PMID: 21833015
- PMCID: PMC3213272
- DOI: 10.1038/jid.2011.241
Dysfunctional γδ T cells contribute to impaired keratinocyte homeostasis in mouse models of obesity
Abstract
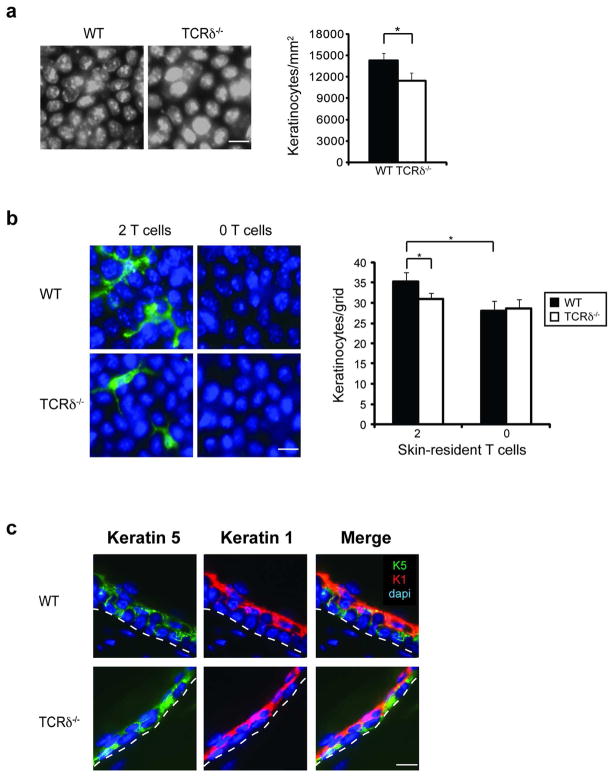
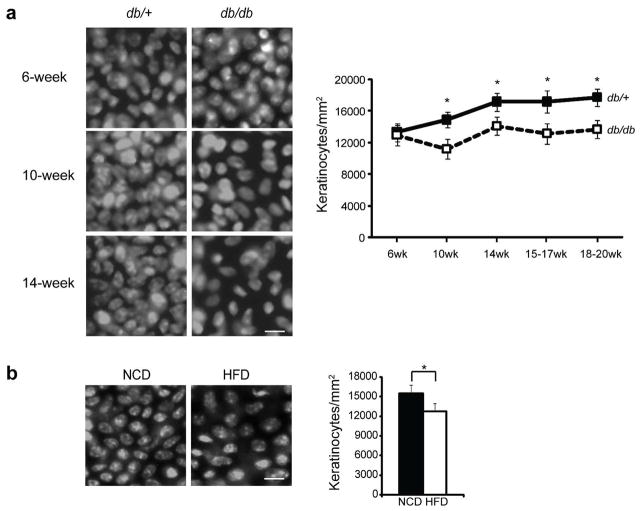
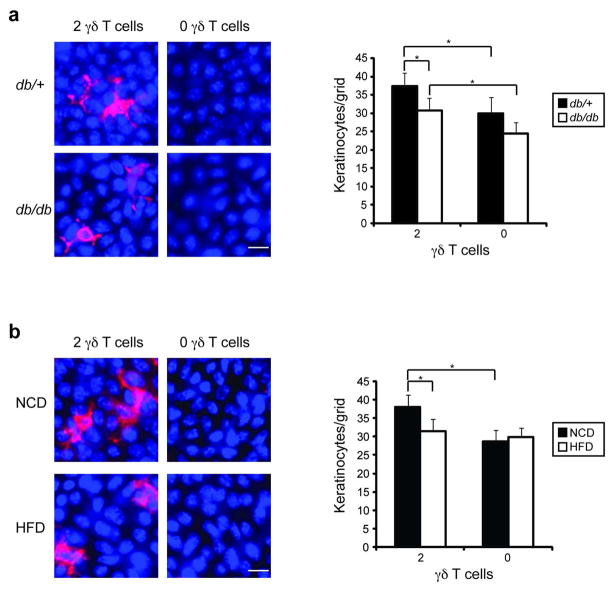
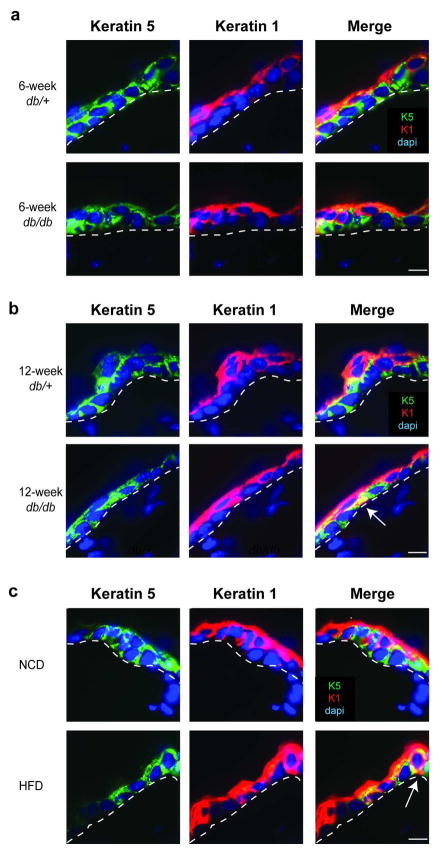
Skin complications and chronic non-healing wounds are common in obesity, metabolic disease, and type 2 diabetes. Epidermal γδ T cells normally produce keratinocyte growth factors, participate in wound repair, and are necessary for keratinocyte homeostasis. We have determined that in γδ T cell-deficient mice, there are reduced numbers of keratinocytes and the epidermis exhibits a flattened, thinner structure with fewer basal keratinocytes. This is important in obesity, where skin-resident γδ T cells are reduced and rendered dysfunctional. Similar to γδ T cell-deficient mice, keratinocytes are reduced and the epidermal structure is altered in two obese mouse models. Even in regions where γδ T cells are present, there are fewer keratinocytes in obese mice, indicating that dysfunctional γδ T cells are unable to regulate keratinocyte homeostasis. The impact of absent or impaired γδ T cells on epidermal structure is exacerbated in obesity as E-cadherin localization and expression are additionally altered. These studies reveal that γδ T cells are unable to regulate keratinocyte homeostasis in obesity and that the obese environment further impairs skin structure by altering cell-cell adhesion. Together, impaired keratinocyte homeostasis and epidermal barrier function through direct and indirect mechanisms result in susceptibility to skin complications, chronic wounds, and infection.
Conflict of interest statement
The authors declare no conflict of interest.
Figures
Similar articles
-
Skin Resident γδ T Cell Function and Regulation in Wound Repair.Int J Mol Sci. 2020 Dec 5;21(23):9286. doi: 10.3390/ijms21239286. Int J Mol Sci. 2020. PMID: 33291435 Free PMC article. Review.
-
A keratinocyte-responsive gamma delta TCR is necessary for dendritic epidermal T cell activation by damaged keratinocytes and maintenance in the epidermis.J Immunol. 2004 Mar 15;172(6):3573-9. doi: 10.4049/jimmunol.172.6.3573. J Immunol. 2004. PMID: 15004158
-
Accumulation and activation of epidermal γδ T cells in a mouse model of chronic dermatitis is not required for the inflammatory phenotype.Eur J Immunol. 2015 Sep;45(9):2517-28. doi: 10.1002/eji.201545675. Epub 2015 Jul 6. Eur J Immunol. 2015. PMID: 26081170
-
Defects in skin gamma delta T cell function contribute to delayed wound repair in rapamycin-treated mice.J Immunol. 2008 Sep 15;181(6):3974-83. doi: 10.4049/jimmunol.181.6.3974. J Immunol. 2008. PMID: 18768852 Free PMC article.
-
Skin gammadelta T-cell functions in homeostasis and wound healing.Immunol Rev. 2007 Feb;215:114-22. doi: 10.1111/j.1600-065X.2006.00483.x. Immunol Rev. 2007. PMID: 17291283 Review.
Cited by
-
Human αβ and γδ T Cells in Skin Immunity and Disease.Front Immunol. 2018 Jun 6;9:1304. doi: 10.3389/fimmu.2018.01304. eCollection 2018. Front Immunol. 2018. PMID: 29928283 Free PMC article. Review.
-
Adipocytes in skin health and disease.Cold Spring Harb Perspect Med. 2014 Mar 1;4(3):a015271. doi: 10.1101/cshperspect.a015271. Cold Spring Harb Perspect Med. 2014. PMID: 24591537 Free PMC article. Review.
-
The Role of Adipocytes in Tissue Regeneration and Stem Cell Niches.Annu Rev Cell Dev Biol. 2016 Oct 6;32:609-631. doi: 10.1146/annurev-cellbio-111315-125426. Epub 2016 May 4. Annu Rev Cell Dev Biol. 2016. PMID: 27146311 Free PMC article. Review.
-
Immunomodulation at epithelial sites by obesity and metabolic disease.Immunol Res. 2012 Jun;52(3):182-99. doi: 10.1007/s12026-011-8261-7. Immunol Res. 2012. PMID: 22160809 Review.
-
Terminal differentiation of keratinocytes was damaged in type 2 diabetic mice.Mol Biol Rep. 2022 Jul;49(7):5875-5882. doi: 10.1007/s11033-022-07367-4. Epub 2022 Mar 26. Mol Biol Rep. 2022. PMID: 35347543
References
-
- Beer HD, Longaker MT, Werner S. Reduced expression of PDGF and PDGF receptors during impaired wound healing. J Invest Dermatol. 1997;109:132–8. - PubMed
-
- Blakytny R, Jude E. The molecular biology of chronic wounds and delayed healing in diabetes. Diabet Med. 2006;23:594–608. - PubMed
-
- Bos JD, Zonneveld I, Das PK, et al. The skin immune system (SIS): distribution and immunophenotype of lymphocyte subpopulations in normal human skin. J Invest Dermatol. 1987;88:569–73. - PubMed
-
- Clark RA, Chong B, Mirchandani N, et al. The vast majority of CLA+ T cells are resident in normal skin. J Immunol. 2006;176:4431–9. - PubMed
-
- Dejana E, Orsenigo F, Lampugnani MG. The role of adherens junctions and VE-cadherin in the control of vascular permeability. J Cell Sci. 2008;121:2115–22. - PubMed
Publication types
MeSH terms
Substances
Grants and funding
LinkOut - more resources
Full Text Sources
Medical
Molecular Biology Databases
