. 2011 Oct 7;286(40):34690-9.
doi: 10.1074/jbc.M111.261321. Epub 2011 Aug 10.

Hsc70 protein interaction with soluble and fibrillar alpha-synuclein

Affiliations

Hsc70 protein interaction with soluble and fibrillar alpha-synuclein

Samantha Pemberton et al. J Biol Chem. .

Abstract

The aggregation of α-synuclein (α-Syn), the primary component of Lewy bodies, into high molecular weight assemblies is strongly associated with Parkinson disease. This event is believed to result from a conformational change within native α-Syn. Molecular chaperones exert critical housekeeping functions in vivo including refolding, maintaining in a soluble state, and/or pacifying protein aggregates. The influence of the stress-induced heat shock protein 70 (Hsp70) on α-Syn aggregation has been notably investigated. The constitutively expressed chaperone Hsc70 acts as an antiaggregation barrier before cells are overwhelmed with α-Syn aggregates and Hsp70 expression induced. Here, we investigate the interaction between Hsc70 and α-Syn, the consequences of this interaction, and the role of nucleotides and co-chaperones Hdj1 and Hdj2 as modulators. We show that Hsc70 sequesters soluble α-Syn in an assembly incompetent complex in the absence of ATP. The affinity of Hsc70 for soluble α-Syn diminishes upon addition of ATP alone or together with its co-chaperones Hdj1 or Hdj2 allowing faster binding and release of client proteins thus abolishing α-Syn assembly inhibition by Hsc70. We show that Hsc70 binds α-Syn fibrils with a 5-fold tighter affinity compared with soluble α-Syn. This suggests that Hsc70 preferentially interacts with high molecular weight α-Syn assemblies in vivo. Hsc70 binding certainly has an impact on the physicochemical properties of α-Syn assemblies. We show a reduced cellular toxicity of α-Syn fibrils coated with Hsc70 compared with "naked" fibrils. Hsc70 may therefore significantly affect the cellular propagation of α-Syn aggregates and their spread throughout the central nervous system in Parkinson disease.


Figures
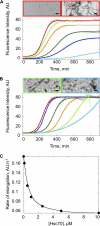
FIGURE 1.
FIGURE 1.
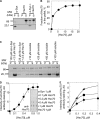
Assembly of α-Syn in the presence of Hsc70. A, time courses of α-Syn assembly at 37 °C and increasing concentrations (10 μm, light blue; 20 μm, dark blue; 30 μm, dark green; 60 μm, orange; 80 μm, light green; and 100 μm, red) in 50 mm Tris-HCl, pH 7.5, 150 mm KCl. The assembly reactions were monitored by ThioT binding. AU, arbitrary units. Negative stained electron micrographs of α-Syn (100 μm) at 0 min (left) and 1000 min (right) after the onset of the assembly reaction. Bar, 0.2 μm. B, time courses of α-Syn (100 μm) assembly in the absence (red) and presence of increasing amounts of Hsc70 (0.1 μm, dark blue; 0.5 μm, dark green; 1 μm, orange; 5 μm, light green; 10 μm, light blue). Negative stained electron micrographs of α-Syn (100 μm) assemblies obtained in the presence of 5 (left) or 10 μm Hsc70 (right) at 1000 min. Bar, 0.2 μm. C, rate of α-Syn fibril elongation at a constant α-Syn concentration (100 μm) and increasing Hsc70 concentrations (0.1–10 μm).
FIGURE 2.
FIGURE 2.
Soluble α-Syn-Hsc70 interaction. A, anti-α-Syn (left) and anti-Hsc70 (right) antibody staining after SDD-AGE analysis and Southern blotting onto nitrocellulose membranes of sample aliquots at the onset of assembly (0 min) and at the steady state (1000 min). The concentration of α-Syn (100 μm) is held constant, although Hsc70 varies from 1 to 10 μm as indicated. B, sedimentation velocity of α-Syn (80 μm, left), Hsc70 (20 μm, middle), and α-Syn/Hsc70 mixture (80 and 20 μm, respectively, right) in 50 mm Tris-HCl, pH 7.5, 150 mm KCl. The positions of the moving boundaries shown were recorded at 5-min intervals by spectrophotometric scanning at 280 nm. The continuous lines are best fits of the experimental data (●). The rotor speed was 180,000 × g and the temperature 15 °C.
FIGURE 3.
FIGURE 3.
Fibrillar α-Syn-Hsc70 interaction. A, SDS-PAGE analysis of the pellet (P) and supernatant (S) fractions of fibrillar α-Syn (80 μm), Hsc70 (8 μm), and fibrillar α-Syn (80 μm) incubated with Hsc70 (8 μm) for 1 h at 37 °C. B, fraction of Hsc70 in the pellet after incubation at 37 °C for 1 h at a constant amount of fibrillar α-Syn (80 μm) with increasing concentrations of Hsc70 (0–20 μm), followed by ultracentrifugation at 90,000 × g for 20 min. C, competition between soluble and fibrillar α-Syn for the binding of Hsc70. The binding of Hsc70 to fibrillar α-Syn was assessed by SDS-PAGE analysis of the pellet and supernatant fractions after incubating fibrillar α-Syn (25 μm) with Hsc70 (2.5 μm) and increasing concentrations of soluble α-Syn (0–100 μm), for 1 h at room temperature. D, quantification of the amount of Hsc70 bound to a constant concentration of fibrillar α-Syn (1 μm) using a filter trap assay followed by anti-Hsc70 antibody staining (inset) at increasing Hsc70 concentrations (0–1 μm). E, quantification of the amount of Hsc70 trapped on nitrocellulose filters in the presence of fibrillar α-Syn (circle, 0.5 μm; square, 1 μm; triangle, 2 μm) at increasing concentrations of Hsc70 (0–0.4 μm). The molecular mass markers (in kilodaltons) are shown to the left in A and C. AU, arbitrary units.
FIGURE 4.
FIGURE 4.
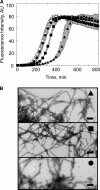
Effect of nucleotides on the assembly of α-Syn in the presence of Hsc70. A, time courses of α-Syn (100 μm) assembly (○) in the presence of Hsc70 (1 μm) in the absence of nucleotide (▴) and the presence of ATP (0.5 mm, ■) or ADP (0.5 mm, ●) in 50 mm Tris-HCl, pH 7.5, 150 mm KCl, 0.05 mm MgCl2. B, negative stained electron micrographs of α-Syn assemblies at 1000 min, labeled with symbols corresponding to those used for the assembly reactions shown in A. Bar, 0.2 μm. AU, arbitrary units.
FIGURE 5.
FIGURE 5.
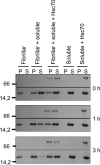
Inhibition of soluble α-Syn incorporation within preformed α-Syn fibrils by Hsc70. Time course of fibrillar α-Syn elongation assessed by SDS-PAGE analysis of the pellet (P) and supernatant (S) fractions after incubating fibrillar α-Syn (25 μm) with soluble α-Syn (25 μm) in the absence or presence of Hsc70 (2.5 μm), as indicated. The molecular mass markers (in kilodaltons) are shown to the left of the panel.
FIGURE 6.
FIGURE 6.
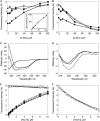
Conformational changes within Hsc70 upon interaction with soluble α-Syn. Top panels, changes in tryptophan fluorescence (excitation 285 nm, emission 305 nm) of Hsc70 incubated for 1 h at 37 °C, in 50 mm Tris-HCl, pH 7.5, 150 mm KCl, 0.5 mm ATP, and 0.05 mm MgCl2 with increasing concentrations of soluble α-Syn. A, fluorescence intensity recorded for 5 μm Hsc70 (●), 10 μm Hsc70 (■), or 25 μm Hsc70 (▾) with increasing concentrations of α-Syn. Inset, light scattering (at 350 nm) of Hsc70 (25 μm) with increasing concentrations of α-Syn (0.1 to 100 μm) (○) and fibrillar α-Syn as a control (0 to 100 μm, ●). B, change in fluorescence intensity after subtracting the contribution of α-Syn from the overall signal in α-Syn/Hsc70 mixtures. Middle panel, far-UV circular dichroism. C, spectra of Hsc70 (25 μm, dot-dashed line), α-Syn (50 μm, solid line), and α-Syn·Hsc70 complex (dashed line). The latter spectrum clearly differs from the theoretical one (dotted line) obtained by summing the spectra of Hsc70 and α-Syn. D, difference spectra obtained upon subtracting experimental spectra for 5 (solid line), 10 (dot-dashed line), or 25 μm (dotted line) Hsc70 with 50 μm α-Syn from the calculated theoretical respective spectra. The spectra were obtained at 20 °C using a JASCO J-810 dichrograph equipped with a thermostated cell holder using a 0.1-cm path length quartz cuvette. Each spectrum was the average of 10 acquisitions recorded in the 260–195 nm range with 0.5-nm steps, a bandwidth of 2 nm, and at a speed of 100 nm min−1. Lower panel, changes in tryptophan fluorescence (excitation 285 nm, emission 305 nm) of α-Syn (100 μm) incubated for 1 h at 37 °C, in 50 mm Tris-HCl, pH 7.5, 150 mm KCl, 0.5 mm ATP, and 0.05 mm MgCl2 with increasing concentrations of Hsc70 (0.1 to 10 μm, solid line), Hsc70 and Hdj1 (dotted line), or Hsc70 and Hdj2 (dashed line). A, fluorescence intensity recorded for increasing concentrations of Hsc70, Hsc70 and Hdj1, or Hsc70 and Hdj2 alone (filled symbols) or in the presence of α-Syn (open symbols). B, change in fluorescence intensity after subtracting the contribution of Hsc70, Hsc70 and Hdj1, or Hsc70 and Hdj2 from the overall signal in α-Syn-Hsc70, Hsc70 and Hdj1, or Hsc70 and Hdj2 mixtures.
FIGURE 7.
FIGURE 7.
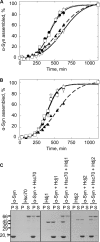
Hdj1 and Hdj2 modulate the interaction between soluble or fibrillar α-Syn and Hsc70. A, time courses of α-Syn (100 μm) assembly in the absence (●) or presence of Hsc70 (1 μm) alone (▴), Hdj1 (1 μm) alone (▿), and Hsc70 and Hdj1 (1 μm each, □) in 50 mm Tris-HCl, pH 7.5, 150 mm KCl, 0.5 mm ATP, and 0.05 mm MgCl2. B, time courses of α-Syn (100 μm) assembly in the absence (●) or presence of Hsc70 (1 μm) alone (▴), Hdj2 (1 μm) alone (▿), and Hsc70 and Hdj2 (1 μm each, □) in 50 mm Tris-HCl, pH 7.5, 150 mm KCl, 0.5 mm ATP, and 0.05 mm MgCl2. The assembly reactions in A and B were monitored by quantifying α-Syn within the supernatant and pellet fractions by SDS-PAGE, as described under “Experimental Procedures.” C, SDS-PAGE analysis of the pellet (P) and supernatant (S) fractions of preformed α-Syn fibrils (60 μm) in the absence and presence of Hsc70 (6 μm), Hdj1 (6 μm), Hdj2 (6 μm), or Hsc70 and its co-chaperone (6 μm each), as indicated. Samples were incubated for 1 h at 37 °C prior to 20 min centrifugation at 90,000 × g, 20 °C. The molecular mass markers (in kilodaltons) are shown to the left of B.
FIGURE 8.
FIGURE 8.
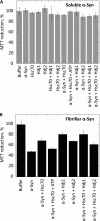
Viability of H-END cells upon exposure to soluble (A, gray) or fibrillar (B, black) α-Syn in the absence or presence of Hsc70 and/or Hdj1 or Hdj2, as indicated. Before exposure to cells, soluble or fibrillar α-Syn (100 μm) was incubated for 1 h at 37 °C with Hsc70 (25 μm), Hdj1 (25 μm), Hdj2 (25 μm), Hsc70 and Hdj1 (25 μm each protein), or Hsc70 and Hdj2 (25 μm each protein). Fibrillar α-Syn was centrifuged for 20 min at 16,100 × g and the pellet was resuspended in the culture medium to remove unbound Hsc70, Hdj1, or Hdj2. The final protein concentration within the culture medium was 1 μm. The cells were incubated with the different proteins for 24 h. Cell viability is expressed as the percentage of 3-(4,5-dimethylthiazol-2-yl)-2,5-diphenyltetrazolium bromide (MTT) reduction using cells treated with the same volume of buffer as a reference (100% 3-(4,5-dimethylthiazol-2-yl)-2,5-diphenyltetrazolium bromide reduction). The values are averages ± S.D. obtained from three independent experiments.

Similar articles

Cited by

References

    1. Spillantini M. G., Schmidt M. L., Lee V. M., Trojanowski J. Q., Jakes R., Goedert M. (1997) Nature 388, 839–840 - PubMed
    1. Norris E. H., Giasson B. I., Lee V. M. (2004) Curr. Top. Dev. Biol. 60, 17–54 - PubMed
    1. Jakes R., Spillantini M. G., Goedert M. (1994) FEBS Lett. 345, 27–32 - PubMed
    1. Burré J., Sharma M., Tsetsenis T., Buchman V., Etherton M. R., Südhof T. C. (2010) Science 329, 1663–1667 - PMC - PubMed
    1. Davies P., Moualla D., Brown D. R.(2011) PLoS One 6, e15814 - PMC - PubMed

Publication types

LinkOut - more resources