. 2011;6(7):e23062.
doi: 10.1371/journal.pone.0023062. Epub 2011 Jul 29.

Targeting the NG2/CSPG4 proteoglycan retards tumour growth and angiogenesis in preclinical models of GBM and melanoma

Affiliations

Targeting the NG2/CSPG4 proteoglycan retards tumour growth and angiogenesis in preclinical models of GBM and melanoma

Jian Wang et al. PLoS One. 2011.

Abstract

Aberrant expression of the progenitor marker Neuron-glia 2 (NG2/CSPG4) or melanoma proteoglycan on cancer cells and angiogenic vasculature is associated with an aggressive disease course in several malignancies including glioblastoma multiforme (GBM) and melanoma. Thus, we investigated the mechanism of NG2 mediated malignant progression and its potential as a therapeutic target in clinically relevant GBM and melanoma animal models. Xenografting NG2 overexpressing GBM cell lines resulted in increased growth rate, angiogenesis and vascular permeability compared to control, NG2 negative tumours. The effect of abrogating NG2 function was investigated after intracerebral delivery of lentivirally encoded shRNAs targeting NG2 in patient GBM xenografts as well as in established subcutaneous A375 melanoma tumours. NG2 knockdown reduced melanoma proliferation and increased apoptosis and necrosis. Targeting NG2 in two heterogeneous GBM xenografts significantly reduced tumour growth and oedema levels, angiogenesis and normalised vascular function. Vascular normalisation resulted in increased tumour invasion and decreased apoptosis and necrosis. We conclude that NG2 promotes tumour progression by multiple mechanisms and represents an amenable target for cancer molecular therapy.


Conflict of interest statement

Competing Interests: The authors have declared that no competing interests exist.

Figures

Figure 1
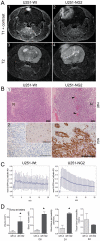
Figure 1. Growth characteristics of NG2 negative and positive tumours.
The upper panels show post-contrast T1-weighted MRI images of U251-wt (A1), and U251-NG2 tumours (A2) and the corresponding T2 weighted images of U251-wt (A3) and U251-NG2 tumours (A4). (B) H&E Comparisons of NG2 U251-Wt (B1, left panel) and U251-NG2 GBMs showing numerous leaky blood vessels, pleomorphic tumour cells and necrosis (B1, right panel). In the NG2 negative U251-Wt tumours (B2, left panel), expression was observed only on oligodendrocyte progenitors in normal brain (B2, insert), Invasive NG2 positive U251-NG2 tumour cells (B2, right panel). (C) Vascular parameters determined from pharmacokinetic models of tracer concentration/time curves where the initial step and slope of the curve is representative of D0 (fractional blood volume), and D1 (blood-tissue permeability), and the decay phase is representative of K2 (washout of tracer). Significant increased tumour and vasogenic oedema volumes of U251-NG2 tumours compared to U251-wt tumours (D, *p<0.05). Significant elevation of D1 (D, Mann Whitney U Test; *p = 0.0317) and D0 in the U251-NG2 tumours (D, Mann Whitney U Test; *p = 0.0159) compared to U251-wt tumours. K2 levels in the NG2 positive and negative tumours (D, Mann Whitney Test; p = 0.73). Scale bars in B1 = 100 µm, magnification 100×; scale bars in B2 = 100 µm, magnification 200×. N denotes necrosis; arrowheads: large vessels “vascular lakes”.
Figure 2
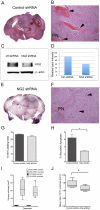
Figure 2. NG2 knockdown in patient biopsy GBM xenografts is associated with reduced tumour volume.
MRI of the patient 3: T2 weighted image (A1), and T1 weighted image post contrast administration (A4). Animals xenografted with P3 biopsy tissue from the same tumour, T2 weighted (A2), and post-contrast T1 weighted images (A5). MRI of the NG2 shRNA treated animals T2 weighted images (A3), and T1 weighted images (A6). Tumour (B left boxes, *p = 0.015, t-test) and lesion volumes (B, right boxes, *p = 0.015, t-test) were significantly reduced in the NG2 shRNA tumours compared to the shRNA control tumours. Ki67 labelling in the NG2 shRNA tumours compared to the control shRNA tumours (C, p>0.05). Apoptosis/Necrosis measured by TUNEL staining was reduced in the NG2 knockdown tumours (D, p>0.05). Arrowheads in A2 and A3 indicate regions of high signal intensity.
Figure 3
Figure 3. NG2 knockdown in GBM biopsy xenografts reduced angiogenesis and increased tumour invasion.
Heterogeneous GBM in situ with pleomorphic nuclei, microvascular proliferations (arrowheads) and pseudopalisading necrosis (PN) (A1). Patient GBM cells diffusely invading the brain parenchyma (A2, scalebar = 100 µm). Expansive, control shRNA treated tumour (B, 1), Inserts: areas with increased T1 weighted signal post contrast overlayed on T2 weighted MR images. NG2 shRNA treated tumours dissemination throughout the brain (B2). Pseudopalisading necrosis (PN), and large vessel sprouting (arrowheads) in the shRNA control treated tumours (C1) compared to NG2 shRNA treated xenografts (C2, arrowheads), scale bar = 100 µm). Immunostaining for vWF in control shRNA (D1) and NG2 shRNA treated tumours (D2), scalebar = 100 µm). Quantification of vWF positive area fraction (**p = 0.006, t-test) and microvascular density (*p = 0.010, t-test) in control shRNA compared to NG2 shRNA treated tumours (E, left and right respectively), scale bar = 100 µm). NG2 positive vessels (brown) in control shRNA (F1) compared to NG2 shRNA (F2) treated tumours (scalebar = 100 µm). Quantification of NG2 positive area fraction (G, left panel, ***p = 0.0003, t-test) and microvascular density (G, right panel, **p = 0.0025 t-test) in control shRNA and NG2 shRNA treated tumours. Contrast ratio between tumour tissue and normal brain in T1 weighted post contrast images in the control and NG2 shRNA treated tumour xenografts (H, *p = 0.032 t-test). Kaplan–Meier survival curves (I, p = 0.3; Log-Rank test).
Figure 4
Figure 4. NG2 knockdown in GBM xenografts reduced large, haemorrhagic vessels and vasogenic oedema.
H&E stained composite image showing expansive, haemorrhagic and highly angiogenic P13 tumour treated with control shRNA (A). Large leaky vessels with phenotype of “vascular lakes” in the control shRNA treated tumours (B, arrowheads, scale bars = 100 µm). Immunoblot showing NG2 expression after treatment with control shRNA (C) and NG2 shRNAs (D) in P13 tumour cells indicating knockdown. H&E stained composite image showing less vascular and non-haemorrhagic NG2 shRNA treated tumour (E). H&E showing pseudopalisading necrosis (PN), fewer and morphologically smaller vessels after treatment with NG2 shRNAs (F, arrowheads), scale bars = 100 µm). Ki67 labelling in the control and NG2 shRNA treated tumours (G, p>0.05 t-test). % Necrosis/Apoptosis measured by TUNEL staining was reduced in the NG2 knockdown tumours (H, *p = 0.02, t-test). Tumour volumes before and after treatment with control and NG2 shRNAs (I, p>0.05, t-test). The oedema levels measured by the ratio of the total lesion volume (T2 w signal change)/solid tumour volume (T1w post contrast signal change) (J) in the control and NG2 shRNA treated tumours (*p = 0.043).
Figure 5
Figure 5. NG2 knockdown in GBM xenografts increased vascular reabsorption, decreased plasma volume and normalized tumour vasculature.
Post-contrast T1 weighted images of representative animals xenografted with P13 biopsy tissue and treated with control shRNAs (A), or NG2 shRNAs (B). Kep maps representing efflux of gadodiamide contrast from the extracellular space to the plasma in representative animals treated with control shRNAs (C) and with NG2 shRNAs (D). Fractional plasma volume maps in the same animals treated with control shRNAs (E) and with NG2 shRNAs (F). Quantification of Kep (G, p = 0.018, t-test) and fractional plasma volume (H, p>0.05) in animals treated with control shRNAs compared to NG2 shRNAs. Vascular parameters determined from pharmacokinetic models of gadodiamide induced signal intensity change from baseline/time curves from representative animals in C-F, where the initial step of the curve represents (vascular filling), the slope represents (flow and permeability), the maximum enhancement represents (leakage space) and decay phase represents the washout of tracer (I). Immunostaining for vWF in control shRNA (J, left panel) and NG2 shRNA treated tumours (J, right panel), scalebar = 100 µm). Quantification of vWF positive microvascular density (K, p>0.05) and area fraction (L, p = 0.04, t-test) in control shRNA compared to NG2 shRNA treated tumours, scale bar = 100 µm). NG2 positive tumour cells and vessels in control shRNA treated (M, left panel) compared to NG2 shRNA treated tumours (M, right panel, scalebar = 100 µm). Quantification of NG2 positive microvascular density (N, p>0.05) and area fraction (O, p>0.05) in control shRNA and NG2 shRNA treated tumours, *p<0.05.
Figure 6
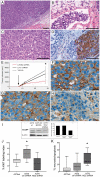
Figure 6. NG2 knockdown in melanomas diminishes tumour growth and proliferation.
Well-demarcated, subcutaneous solid tumour (A), and lymphatic vessel infiltration (B), Solid groups of polygonal atypical tumour cells showing moderate pleomorphic nuclei with prominent eosinophilic nucleoli interspersed with connective tissue (C). Partial S-100 protein expression (D), Magnification, 200×. Growth curves of established A375 melanoma tumours treated with vehicle, control and NG2 shRNAs in in vivo (E, Two-Way ANOVA F8.28, df = 13; *p<0.0005). Arrow indicates beginning of lentiviral shRNAs or vehicle injections at day 7. Cell surface NG2 expression in parental A375 tumours (F), and in control non-functional shRNA transduced tumours (G). Reduced NG2 immunoreactivity in the NG2 shRNA transduced tumours (H), and A375 melaoma protein lysates (I). Magnification 1000×. Quantification of Ki67 positive tumour cells (J, One-way ANOVA F9.259; df = 3; *p = 0.0006) and cell death (necrotic/apoptotic cells by TUNEL positivity (K, One-Way ANOVA F37.53; df = 3; *p = 0.0001). Data represent mean ±SEM. Scale bars in A = 200 µm magnification 100×; Scale bars in B-D = 200 µm magnification 400×; Scale bars F-H = 200 µm, magnification 1000×.

Similar articles

Cited by

References

    1. Ohgaki H, Kleihues P. Population-based studies on incidence, survival rates, and genetic alterations in astrocytic and oligodendroglial gliomas. J Neuropathol Exp Neurol. 2005;64:479–489. - PubMed
    1. Smith JS, Jenkins RB. Genetic alterations in adult diffuse glioma: occurrence, significance, and prognostic implications. Front Biosci. 2000;5:D213–231. - PubMed
    1. Stupp R, Mason WP, van den Bent MJ, Weller M, Fisher B, et al. Radiotherapy plus concomitant and adjuvant temozolomide for glioblastoma. N Engl J Med. 2005;352:987–996. - PubMed
    1. Behm FG, Smith FO, Raimondi SC, Pui CH, Bernstein ID. Human homologue of the rat chondroitin sulfate proteoglycan, NG2, detected by monoclonal antibody 7.1, identifies childhood acute lymphoblastic leukemias with t(4;11)(q21;q23) or t(11;19)(q23;p13) and MLL gene rearrangements. Blood. 1996;87:1134–1139. - PubMed
    1. Chekenya M, Enger PO, Thorsen F, Tysnes BB, Al-Sarraj S, et al. The glial precursor proteoglycan, NG2, is expressed on tumour neovasculature by vascular pericytes in human malignant brain tumours. Neuropathol Appl Neurobiol. 2002;28:367–380. - PubMed

Publication types

MeSH terms