. 2011 Jul;7(7):e1002180.
doi: 10.1371/journal.ppat.1002180. Epub 2011 Jul 28.

EBV latency types adopt alternative chromatin conformations

Affiliations

EBV latency types adopt alternative chromatin conformations

Italo Tempera et al. PLoS Pathog. 2011 Jul.

Abstract

Epstein-Barr Virus (EBV) can establish latent infections with distinct gene expression patterns referred to as latency types. These different latency types are epigenetically stable and correspond to different promoter utilization. Here we explore the three-dimensional conformations of the EBV genome in different latency types. We employed Chromosome Conformation Capture (3C) assay to investigate chromatin loop formation between the OriP enhancer and the promoters that determine type I (Qp) or type III (Cp) gene expression. We show that OriP is in close physical proximity to Qp in type I latency, and to Cp in type III latency. The cellular chromatin insulator and boundary factor CTCF was implicated in EBV chromatin loop formation. Combining 3C and ChIP assays we found that CTCF is physically associated with OriP-Qp loop formation in type I and OriP-Cp loop formation in type III latency. Mutations in the CTCF binding site located at Qp disrupt loop formation between Qp and OriP, and lead to the activation of Cp transcription. Mutation of the CTCF binding site at Cp, as well as siRNA depletion of CTCF eliminates both OriP-associated loops, indicating that CTCF plays an integral role in loop formation. These data indicate that epigenetically stable EBV latency types adopt distinct chromatin architectures that depend on CTCF and mediate alternative promoter targeting by the OriP enhancer.


Conflict of interest statement

The authors have declared that no competing interests exist.

Figures

Figure 1
Figure 1. OriP region forms alternative chromatin loops in type I and type III latency types.
A) Schematic of type I and type III promoter usage and relative position of OriP, Cp, and Qp are indicated. Green boxes indicate known CTCF binding sites. B) Schematic of MseI restriction site map and the anchor primers used for Qp, Cp, and control. EBV genome coordinates for each anchor primer are indicated. C) 3C PCR analysis using the Qp anchor primers and several acceptor regions of EBV genome for FR, DS, 10.6, 11 11.3, 36, 113, and 126 kbp. Representative gel images for Mutu I (top), Mutu-LCL (middle) or control bacmid ligation mixtures (lower) are indicated. D) Representative gel images of 3C PCR analysis using the Cp anchor primer and several acceptor regions of the EBV genome as indicated. E) Representative gel images of 3C PCR analysis using the anchor primer within the fragment chosen as control and several regions of the EBV genome, as indicated.
Figure 2
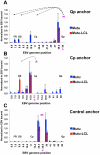
Figure 2. Quantitative 3C analysis confirms alternative loop formation between type I and type III latency types.
3C assay coupled with quantitative PCR was used to analyze chromatin architecture of the EBV genome in type I (Mutu) and type III (Mutu-LCL) latencies. EBV genome coordinates of all the Mse I fragments tested are indicated on the X-axis. A pink asterisk indicates fragment bearing the anchor primer. Loop formation between the anchor primer (pink box) and an Mse I fragment is indicated by dashed arrows. Data were analyzed using the ΔCt method, and Ct values generated by using 100 ng of EBV bacmid DNA Mse I digested and randomly ligated were used as the control. Data were obtained by three independent experiments and expressed as mean ± SE. Data generated by the anchor fragment self-ligation product were removed from analysis. (A) Quantitative 3C analysis using the anchor primer within the fragment containing Qp and several regions of the EBV genome. (B) Quantitative 3C analysis using the anchor primer within the fragment containing Cp and several regions of the EBV genome. (C) Quantitative 3C analysis using the anchor primer within the fragment chosen as control and several regions of the EBV genome.
Figure 3
Figure 3. Interaction between OriP binding factors and promoters correlates with promoter activation.
ChIP-qPCR analysis of EBNA1, ORC2, and TRF2 at target regions in type I (Mutu, blue) and type III (Mutu-LCL, red) type latency. Target regions were Cp (panel A), Qp (panel B), DS (panel C), and OriLyt (panel D), as indicated. ChIP-qPCR was performed in conditions that preserved chromatin loop formation. Each bar represents the mean ± SE of three independent experiments. Data are expressed as fold enrichment of specific factor binding relative to that of an IgG control.
Figure 4
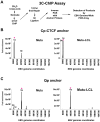
Figure 4. Chromosome Conformation Capture Chromatin Immunoprecipitation (3C-ChIP) analysis shows that CTCF is involved in chromatin looping in EBV.
A) Schematic description of the 3C-ChIP assay used for analysis of CTCF mediated interactions with the EBV genome. B and C) 3C-ChIP assay using either Cp-CTCF anchor primers (panels B) or Qp anchor primers (panels C) with Mutu (left panel) or Mutu-LCL (right panel). Anchor primer regions are indicated by an asterisk. EBV genome coordinates of EBV 384-well genome array are indicated on the X-axis. Data are representative of two independent experiments and are expressed as fold enrichment of CTCF binding over that of an IgG control. Only data with a SD less then 10% were considered.
Figure 5
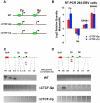
Figure 5. Mutation in the CTCF binding site at Qp and at Cp alters chromatin conformation and promoter activation.
(A) Schematic representation of the EBV genome around the Cp and Qp promoters in the Wt and mutant bacmids. A red dashed line represents mutations that abolish CTCF binding. Green circles indicate known CTCF binding sites. (B) Analysis of mRNA expression for EBNA1 and EBNA2 gene and promoter utilization by RT-qPCR. Data are normalized to GFP protein and expressed as log22ΔΔC t. Each bar represents the mean ± SE of three independent experiments. (C) Representative gel images of 3C PCR analysis using the anchor primer within the fragment containing Qp promoter and several regions of EBV genome for Wt (top panel) or ΔCTCF-Qp (middle panel) or ΔCTCF-Cp (lower panel). (D) Representative gel imagine of 3C PCR analysis using the anchor primer within the fragment containing Cp promoter and several regions of the EBV genome for Wt (top panel) or ΔCTCF-Qp (middle panel) or ΔCTCF-Cp (lower panel).
Figure 6
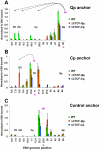
Figure 6. Quantitative 3C analysis confirms changes in chromatin architecture in ΔCTCF-Qp and ΔCTCF-Qp compared to Wt EBV bacmid.
3C assay coupled with quantitative PCR was used to analyze EBV chromatin architecture in 293-EBV Wt bacmid, 293-EBV ΔCTCF-Qp and 293-EBV ΔCTCF-Cp stable cell lines. EBV genome coordinates of all the MseI fragments tested are indicated on the X-axis. A pink asterisk indicates the fragment bearing the anchor primer. Loop formation between the anchor primer (pink box) and a MseI fragment is indicated by dashed arrows. PCR amplification was analyzed using the ΔCt method, and Ct values generated by using 50 ng of EBV bacmid DNA Mse I digested and randomly ligated were used as the control. Data were obtained by three independent experiments and expressed as mean ± SE. Data generated by the anchor fragment self-ligation product were removed from analysis. (A) Quantitative 3C analysis using the anchor primer within the fragment containing Qp and several regions of the EBV genome. (B) Quantitative 3C analysis using the anchor primer within the fragment containing Cp and several regions of EBV genome. (C) Quantitative 3C analysis using the anchor primer within the fragment chosen as control and several regions of the EBV genome.
Figure 7
Figure 7. Absence of chromatin loop formation correlates with a loss of interaction between OriP binding factors ORC2 and TRF2 at Qp.
ChIP-qPCR analysis of EBNA1, ORC2 and TRF2 at target regions in Wt and ΔCTCF EBV-positive 293 stable cell lines. ChIP-qPCR was performed in conditions that preserved chromatin loop formation. Each bar represents the mean ± SE of three independent experiments. Data are expressed as fold enrichment of specific factor binding relative to that of an IgG control. Target regions used for PCR amplification were Cp (panel A), Qp (panel B), DS (panel C), and OriLyt (panel D).
Figure 8
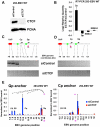
Figure 8. CTCF siRNA depletion disrupts chromatin architecture of EBV.
(A) 293-EBV Wt cell lines were transfected with siRNA against CTCF (siCTCF) or a non-targeting control (siControl). After 72 hrs cells were harvested and then analyzed by western blot with antibody to CTCF (top panel) or loading control PCNA (lower panel) to check depletion efficiency. (B) RT-qPCR analysis of promoter utilization and EBNA1 and EBNA2 gene expression after CTCF depletion. Data are normalized to GFP mRNA and expressed as −ΔΔCt values. Each bar represents the mean ± SE of three independent experiments. (C and D) 3C assay was used to analyze chromatin conformation after depletion of CTCF. Representative gel images of 3C PCR analysis using the anchor primer within the fragment containing Qp promoter (C) or Cp promoter (D) and several regions of the EBV genome for 293-EBV Wt cell line transfected with siControl or siCTCF siRNA. Amplified regions are indicated above each gel. (E) 3C assay coupled with quantitative PCR was used to analyze EBV chromatin architecture in 293-EBV Wt bacmid transfected with siControl or siCTCF siRNA, using the anchor primer within the fragment containing Qp promoter (left panel) or Cp promoter (right panel) and several regions of EBV genome. EBV genome coordinates of all the Mse I fragments tested are indicated on the X-axis. A pink asterisk indicates fragment bearing the anchor primer. Loop formation between anchor primer (pink box) and a Mse I fragment is indicated by dashed arrows. PCR amplification was normalized by using 50 ng of EBV bacmid DNA Mse I digested and randomly ligated. Data were obtained by three independent experiments and expressed as mean ± SE. Data generated by the anchor fragment self-ligation product were removed from analysis.
Figure 9
Figure 9. Model of chromatin conformational control of EBV latency types.
A) Linear model of EBV latency types depicting OriP enhancer interactions with Cp (type III) or Qp (type I). CTCF binding sites are shown as a yellow box with an arrow. B) Conformational model showing OriP recruiting Qp into an active loop and domain in type I cells (top panel), and the alternative conformation where OriP recruits Cp into a loop and active domain in type III cells (lower panel).

Similar articles

Cited by

References

    1. Kieff E. Epstein-Barr Virus and its replication.; In: Fields BN, Knipe DM, Howley PM, editors. Philadelphia: Wolters Kluwer Health/Lippincott Williams & Wilkins; 2007. 2 v. (xix, 3091, 3086 p.)
    1. Rickinson AB, Kieff E. Epstein-Barr Virus.; In: Fields BN, Knipe DM, Howley PM, editors. Philadelphia: Wolters Kluwer Health/Lippincott Williams & Wilkins; 2007. 2 v. (xix, 3091, 3086 p.)
    1. Young LS, Rickinson AB. Epstein-Barr virus: 40 years on. Nat Rev Cancer. 2004;4:757–768. - PubMed
    1. Rowe M, Lear AL, Croom-Carter D, Davies AH, Rickinson AB. Three pathways of Epstein-Barr virus gene activation from EBNA1-positive latency in B lymphocytes. J Virol. 1992;66:122–131. - PMC - PubMed
    1. Miyashita EM, Yang B, Lam KM, Crawford DH, Thorley-Lawson DA. A novel form of Epstein-Barr virus latency in normal B cells in vivo. Cell. 1995;80:593–601. - PubMed

Publication types