

Comparison and calibration of different reporters for quantitative analysis of gene expression
- PMID: 21806921
- PMCID: PMC3145315
- DOI: 10.1016/j.bpj.2011.06.026
Comparison and calibration of different reporters for quantitative analysis of gene expression
Abstract
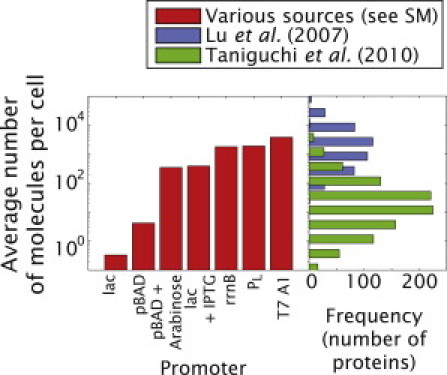
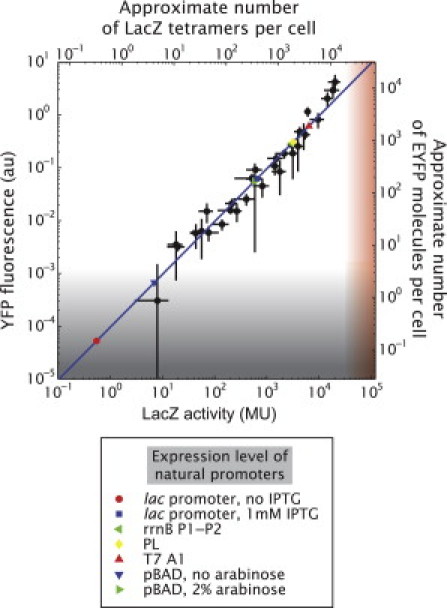
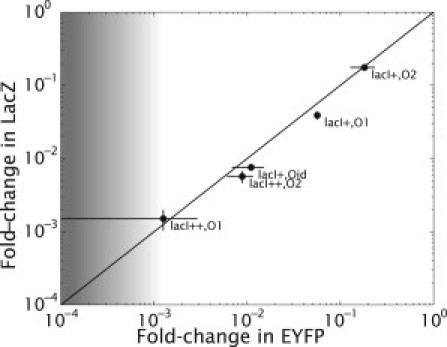
Absolute levels of gene expression in bacteria are observed to vary over as much as six orders of magnitude. Thermodynamic models have been proposed as a tool to describe the expression levels of a given transcriptional circuit. In this context, it is essential to understand both the limitations and linear range of the different methods for measuring gene expression and to determine to what extent measurements from different reporters can be directly compared with one aim being the stringent testing of theoretical descriptions of gene expression. In this article, we compare two protein reporters by measuring both the absolute level of expression and fold-change in expression using the fluorescent protein EYFP and the enzymatic reporter β-galactosidase. We determine their dynamic and linear range and show that they are interchangeable for measuring mean levels of expression over four orders of magnitude. By calibrating these reporters such that they can be interpreted in terms of absolute molecular counts, we establish limits for their applicability: autofluorescence on the lower end of expression for EYFP (at ∼10 molecules per cell) and interference with cellular growth on the high end for β-galactosidase (at ∼20,000 molecules per cell). These qualities make the reporters complementary and necessary when trying to experimentally verify the predictions from the theoretical models.
Copyright © 2011 Biophysical Society. Published by Elsevier Inc. All rights reserved.
Figures
Similar articles
-
Green fluorescent protein as a quantitative reporter of relative promoter activity in E. coli.Biotechniques. 2000 Jan;28(1):82-4, 86, 88-9. doi: 10.2144/00281st02. Biotechniques. 2000. PMID: 10649775
-
ASD-GFP vectors for in vivo expression technology in Pseudomonas aeruginosa and other gram-negative bacteria.Biotechniques. 1998 Feb;24(2):261-4. doi: 10.2144/98242st02. Biotechniques. 1998. PMID: 9494727
-
The design of a new mutation model for active genes: expression of the Escherichia coli lac operon in mammalian cells.Mutat Res. 1997 Sep;382(1-2):21-33. doi: 10.1016/s1383-5726(97)00006-x. Mutat Res. 1997. PMID: 9360635
-
Monitoring gene expression in biofilms.Methods Enzymol. 1999;310:56-79. doi: 10.1016/s0076-6879(99)10006-5. Methods Enzymol. 1999. PMID: 10547782 Review. No abstract available.
-
Beta-galactosidase marker genes to tag and track human hematopoietic cells.Cancer Gene Ther. 1999 Jan-Feb;6(1):3-13. doi: 10.1038/sj.cgt.7700016. Cancer Gene Ther. 1999. PMID: 10078958 Review. No abstract available.
Cited by
-
Growth-mediated negative feedback shapes quantitative antibiotic response.Mol Syst Biol. 2022 Sep;18(9):e10490. doi: 10.15252/msb.202110490. Mol Syst Biol. 2022. PMID: 36124745 Free PMC article.
-
Tuning Transcriptional Regulation through Signaling: A Predictive Theory of Allosteric Induction.Cell Syst. 2018 Apr 25;6(4):456-469.e10. doi: 10.1016/j.cels.2018.02.004. Epub 2018 Mar 21. Cell Syst. 2018. PMID: 29574055 Free PMC article.
-
Single-cell census of mechanosensitive channels in living bacteria.PLoS One. 2012;7(3):e33077. doi: 10.1371/journal.pone.0033077. Epub 2012 Mar 13. PLoS One. 2012. PMID: 22427953 Free PMC article.
-
Operator sequence alters gene expression independently of transcription factor occupancy in bacteria.Cell Rep. 2012 Jul 26;2(1):150-61. doi: 10.1016/j.celrep.2012.06.004. Epub 2012 Jul 12. Cell Rep. 2012. PMID: 22840405 Free PMC article.
-
A computational framework for analyzing stochasticity in gene expression.PLoS Comput Biol. 2014 May 8;10(5):e1003596. doi: 10.1371/journal.pcbi.1003596. eCollection 2014 May. PLoS Comput Biol. 2014. PMID: 24811315 Free PMC article.
References
-
- Ghaemmaghami S., Huh W.K., Weissman J.S. Global analysis of protein expression in yeast. Nature. 2003;425:737–741. - PubMed
-
- Rosenfeld N., Young J.W., Elowitz M.B. Gene regulation at the single-cell level. Science. 2005;307:1962–1965. - PubMed
-
- Zaslaver A., Bren A., Alon U. A comprehensive library of fluorescent transcriptional reporters for Escherichia coli. Nat. Methods. 2006;3:623–628. - PubMed
-
- Ben-Tabou de-Leon S., Davidson E.H. Gene regulation: gene control network in development. Annu. Rev. Biophys. Biomol. Struct. 2007;36:191–212. - PubMed
Publication types
MeSH terms
Substances
Grants and funding
LinkOut - more resources
Full Text Sources
Other Literature Sources
