Human glioblastoma stem-like cells are more sensitive to allogeneic NK and T cell-mediated killing compared with serum-cultured glioblastoma cells
- PMID: 21790828
- PMCID: PMC8029175
- DOI: 10.1111/j.1750-3639.2011.00515.x
Human glioblastoma stem-like cells are more sensitive to allogeneic NK and T cell-mediated killing compared with serum-cultured glioblastoma cells
Abstract
Glioblastoma multiforme (GBM) is the most dramatic primary brain cancer with a very poor prognosis because of inevitable disease recurrence. The median overall survival is less than 1 year after diagnosis. Cancer stem cells have recently been disclosed in GBM. GBM stem-like cells (GSCs) exhibit resistance to radio/chemotherapeutic treatments and are therefore considered to play an important role in disease recurrence. GSCs are thus appealing targets for new treatments for GBM patients. In this study, we show that GBM cells with stem cell characteristics are resistant to lysis mediated by resting natural killer (NK) cells because of the expression of MHC class I molecules. However, GSCs are killed by lectin-activated NK cells. Furthermore, in experiments using the therapeutic antibody CetuximAb, we show that GSCs are sensitive to antibody-mediated cytotoxicity. We confirm the sensitivity of GSC to cytotoxicity carried out by IL2-activated NK cells and tumor-specific T cells. More importantly, we show that GSCs are more sensitive to NK and T cell-mediated lysis relatively to their corresponding serum-cultured GBM cells obtained from the same initial tumor specimen. Altogether, these results demonstrate the sensitivity of GSC to immune cell cytotoxicity and, therefore, strongly suggest that GSCs are suitable target cells for immunotherapy of GBM patients.
© 2011 The Authors. Brain Pathology © 2011 International Society of Neuropathology.
Figures
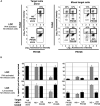
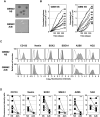
 ), the lectin phytohemagglutinin (PHA) (◆), the therapeutic antibodies TrastuzumAb (○) or CetuximAb (
 ). A representative primary cell line GBM#2 is shown (see Supporting Information Figure S6B for the others cell lines). D. Similar results were obtained with NK cells prepared from four different healthy donors. E : T ratio: 10:1 (see Supporting Information Figure S6C for the others cell lines). ***P < 0.01; *P < 0.05. ns = not statistically different (comparison with lysis with NK cells alone); LDC = lectin‐dependent cytotoxicity; ADCC = antibody‐dependent cell cytotoxicity.
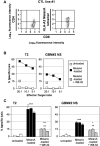
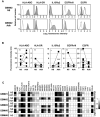
 ) T2 cells (used as positive controls) and GBM NS cell lines in the absence or in the presence of blocking antibodies against HLA‐ABC (
 ). Different effector : target (E : T) ratios were used and specific lysis was calculated as indicated in Figure 3. A representative primary cell line GBM#2 is shown (see Supporting Information Figure S7A for the other cell lines). C. Results are representative of results obtained with three different MelanA/HLA‐A2‐specific T cell lines. E : T ratio: 10:1 (see Supporting Information Figure S7B for the other cell lines). ***P < 0.01; ns, not statistically different (comparison with unloaded target cells). +++
P < 0.01; +
P < 0.05 (comparison with MelanA‐loaded target cells).
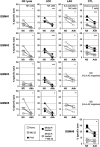
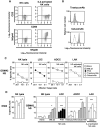
 ), the lectin phytohemagglutinin (PHA) (◆); or IL2‐activated NK cells (□); or MelanA‐specific T cell effectors (
 ). Results are representative of results obtained with four different donors for NK cell effectors and three different MelanA/HLA‐A2‐specific T cell lines. E : T ratio: 10:1. ***P < 0.01; *P < 0.05. ns = not statistically different.
Similar articles
-
Phytosomal curcumin causes natural killer cell-dependent repolarization of glioblastoma (GBM) tumor-associated microglia/macrophages and elimination of GBM and GBM stem cells.J Exp Clin Cancer Res. 2018 Jul 25;37(1):168. doi: 10.1186/s13046-018-0792-5. J Exp Clin Cancer Res. 2018. PMID: 30041669 Free PMC article.
-
Targeting the αv integrin/TGF-β axis improves natural killer cell function against glioblastoma stem cells.J Clin Invest. 2021 Jul 15;131(14):e142116. doi: 10.1172/JCI142116. J Clin Invest. 2021. PMID: 34138753 Free PMC article.
-
Identification of T cell target antigens in glioblastoma stem-like cells using an integrated proteomics-based approach in patient specimens.Acta Neuropathol. 2017 Aug;134(2):297-316. doi: 10.1007/s00401-017-1702-1. Epub 2017 Mar 22. Acta Neuropathol. 2017. PMID: 28332095
-
The Importance of Tumor Stem Cells in Glioblastoma Resistance to Therapy.Int J Mol Sci. 2021 Apr 8;22(8):3863. doi: 10.3390/ijms22083863. Int J Mol Sci. 2021. PMID: 33917954 Free PMC article. Review.
-
Targeting role of glioma stem cells for glioblastoma multiforme.Curr Med Chem. 2013;20(15):1974-84. doi: 10.2174/0929867311320150004. Curr Med Chem. 2013. PMID: 23317162 Review.
Cited by
-
Translational landscape of glioblastoma immunotherapy for physicians: guiding clinical practice with basic scientific evidence.J Hematol Oncol. 2022 Jun 11;15(1):80. doi: 10.1186/s13045-022-01298-0. J Hematol Oncol. 2022. PMID: 35690784 Free PMC article. Review.
-
ER-mitochondria contacts control surface glycan expression and sensitivity to killer lymphocytes in glioma stem-like cells.EMBO J. 2017 Jun 1;36(11):1493-1512. doi: 10.15252/embj.201695429. Epub 2017 Mar 10. EMBO J. 2017. PMID: 28283580 Free PMC article.
-
IRE1 RNase controls CD95-mediated cell death.EMBO Rep. 2024 Apr;25(4):1792-1813. doi: 10.1038/s44319-024-00095-9. Epub 2024 Feb 21. EMBO Rep. 2024. PMID: 38383861 Free PMC article.
-
IRE1 endoribonuclease signaling promotes myeloid cell infiltration in glioblastoma.Neuro Oncol. 2024 May 3;26(5):858-871. doi: 10.1093/neuonc/noad256. Neuro Oncol. 2024. PMID: 38153426 Free PMC article.
-
Targeting glioblastoma with NK cells and mAb against NG2/CSPG4 prolongs animal survival.Oncotarget. 2013 Sep;4(9):1527-46. doi: 10.18632/oncotarget.1291. Oncotarget. 2013. PMID: 24127551 Free PMC article.
References
-
- Aulwurm S, Wischhusen J, Friese M, Borst J, Weller M (2006) Immune stimulatory effects of CD70 override CD70‐mediated immune cell apoptosis in rodent glioma models and confer long‐lasting antiglioma immunity in vivo . Int J Cancer 118:1728–1735. - PubMed
-
- Avril T, Jarousseau AC, Watier H, Boucraut J, Le Bouteiller P, Bardos P, Thibault G (1999) Trophoblast cell line resistance to NK lysis mainly involves an HLA class I‐independent mechanism. J Immunol 162:5902–5909. - PubMed
-
- Avril T, Saikali S, Vauleon E, Jary A, Hamlat A, De Tayrac M et al (2010) Distinct effects of human glioblastoma immunoregulatory molecules programmed cell death ligand‐1 (PDL‐1) and indoleamine 2,3‐dioxygenase (IDO) on tumour‐specific T cell functions. J Neuroimmunol 225:22–33. - PubMed
Publication types
MeSH terms
Substances
LinkOut - more resources
Full Text Sources
Other Literature Sources
Medical
Research Materials

