. 2011 Aug 9;108(32):E440-9.
doi: 10.1073/pnas.1104977108. Epub 2011 Jul 25.

Control of excitatory CNS synaptogenesis by astrocyte-secreted proteins Hevin and SPARC

Affiliations

Control of excitatory CNS synaptogenesis by astrocyte-secreted proteins Hevin and SPARC

Hakan Kucukdereli et al. Proc Natl Acad Sci U S A. .

Abstract

Astrocytes regulate synaptic connectivity in the CNS through secreted signals. Here we identified two astrocyte-secreted proteins, hevin and SPARC, as regulators of excitatory synaptogenesis in vitro and in vivo. Hevin induces the formation of synapses between cultured rat retinal ganglion cells. SPARC is not synaptogenic, but specifically antagonizes synaptogenic function of hevin. Hevin and SPARC are expressed by astrocytes in the superior colliculus, the synaptic target of retinal ganglion cells, concurrent with the excitatory synaptogenesis. Hevin-null mice had fewer excitatory synapses; conversely, SPARC-null mice had increased synaptic connections in the superior colliculus. Furthermore, we found that hevin is required for the structural maturation of the retinocollicular synapses. These results identify hevin as a positive and SPARC as a negative regulator of synapse formation and signify that, through regulation of relative levels of hevin and SPARC, astrocytes might control the formation, maturation, and plasticity of synapses in vivo.


Conflict of interest statement

The authors declare no conflict of interest.

Figures
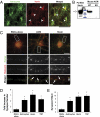
Fig. 1.
Fig. 1.
Hevin is expressed by astrocytes and induces synapse formation on RGCs in culture. (A) A sagittal brain section from a P19 Aldh1-L1–EGFP transgenic mouse that expresses GFP (green) in protoplasmic astrocytes throughout the CNS was stained with a monoclonal antibody against hevin (12:155). Hevin staining (red) colocalizes (arrows) with the GFP expressing astrocytes (green). (Scale bar: 50 μm.) (B) Western blot analysis of astrocyte conditioned media (ACM) from WT and hevin-null mice. WT ACM shows a 130-kDa band corresponding to hevin protein (arrow), which is absent in the ACM from hevin-null (KO) mice. (C) Immunostaining of RGCs with presynaptic marker bassoon (red) and postsynaptic marker homer (green) showed many colocalized synaptic puncta (white arrows) in the presence of ACM or 30 nM purified recombinant hevin (Middle, Right), but few under the condition in which RGCs were cultured alone (Left). Lower: Magnified images of the white rectangles. (Scale bars: 30 μm.) (D) Fold increase in the number of colocalized synaptic puncta formed by RGCs in response to astrocytes (feeder layer inserts), hevin, or TSP1. Fold increase is calculated based on the number of synapses formed by RGCs cultured alone (mean synapse number for RGCs alone condition, 3.0 ± 1.0). (E) Graphical presentation of synaptic density changes in cultured RGCs in response to astrocytes (feeding layer inserts), hevin, or TSP1. Synaptic density indicates the number of synapses per 100 μm neurite. (*P < 0.05; n = 20 cells per condition; error bars indicate SEM).
Fig. 2.
Fig. 2.
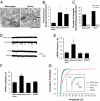
Hevin-induced synapses are ultrastructurally normal but postsynaptically silent. (A) EM images of synapses formed between rat RGCs cultured in the presence of astrocyte feeder layer inserts (astrocytes, Left) or purified hevin (Right). Hevin-induced synapses appear ultrastructurally normal and resemble astrocyte-induced synapses. Pre, presynaptic; post, postsynaptic site. (Scale bar: 250 nm.) (B) Quantification of number of synapses formed onto cultured rat RGCs by EM. RGCs treated with astrocyte feeder layers or hevin formed three- to fivefold more synapses compared with RGCs cultured alone (*P < 0.05; n = 8 cells per condition, error bars indicate SEM). (C) Quantification of the number of synaptic vesicles per presynaptic terminal per EM section. Black bars represent the total number of synaptic vesicles per synapse per section. Gray bars represent the number of docked vesicles (within 50 nm distance of the active zone; P > 0.05, not significant; n = 15 synapses for hevin and n = 17 synapses for astrocyte condition; error bars indicate SEM). (D) Hevin-induced synapses are postsynaptically silent. Representative traces from whole-cell patch-clamp recordings of mEPSCs from RGCs cultured alone, with astrocytes, with 30 nM hevin, or with 100 nM SPARC. Only the RGCs cultured with astrocyte feeder layer inserts (i.e., astrocytes) exhibited an increase in postsynaptic events versus RGCs alone. Quantification of the frequency (E) and amplitude (F) of mEPSCs from RGCs cultured alone, with astrocytes, with 30 nM hevin, or with 100 nM SPARC (*P < 0.01; n = 12 cells per condition; error bars indicate SEM). (G) Cumulative probability plot of the amplitude of mEPSCs recorded from RGCs cultured alone (control), with astrocytes, with 30 nM hevin, or with 100 nM SPARC. Only the mEPSCs from RGCs cultured with astrocytes are larger than those under control conditions. Inset: Average waveforms of mEPSCs from RGCs cultured alone (control), with astrocytes, with 30 nM hevin, or with 100 nM SPARC (n = 12 cells per condition).
Fig. 3.
Fig. 3.
Depletion of hevin from ACM reduces synapse number and synaptic size. (A) Hevin was immunodepleted from mouse ACM with a rabbit polyclonal antibody against mouse hevin bound to Protein A/G beads (Pierce). Mouse ACM was incubated with the antibody bound beads for three rounds (lanes marked 1, 2, and 3). Hevin was detected by Western blotting with a rat monoclonal antibody against mouse Hevin (12:155). After the third round of depletion, no hevin was detected in the ACM. Mock depletion was performed in parallel with Protein A/G beads pretreated with preimmune rabbit serum. Hevin is preserved after mock depletion. (B) Representative images of RGCs that were cultured with mock-depleted ACM (Left), hevin-depleted ACM (Middle), or hevin-depleted ACM supplemented with 30 nM hevin (Right), and stained with presynaptic marker bassoon (red) and postsynaptic marker homer (green). Magnified images corresponding to the white rectangles are presented on the right side of each panel. Colocalized puncta in merged images represent synapses (Scale bars: white, 20 μm; black, 2 μm.) (C) Quantification of the effects of hevin depletion from WT or TSP1/2-deficient (TSP1/2 KO) mouse ACM on synaptic density. For rescue of depletion phenotype, hevin-depleted ACM was supplemented with 30 nM hevin. Synaptic density indicates the number of synapses per 100 μm neurite (*P < 0.05; n = 20 cells per condition, n.s., not significant; error bars indicate SEM).
Fig. 4.
Fig. 4.
SPARC antagonizes the synaptogenic activity of hevin. (A) A sagittal brain section from a P19 Aldh1-L1–EGFP transgenic mouse that expresses GFP (green) in protoplasmic astrocytes throughout the CNS was stained with goat anti-SPARC antibody (R&D Systems). SPARC staining (red) colocalizes (arrowheads) with the GFP expressing astrocytes (green). (Scale bar: 50 μm.) (B) Western blot analysis of rat ACM shows a 43-kDa band corresponding to SPARC protein (black arrow). SPARC o/e, HEK293 cell culture supernatant from cells expressing SPARC. (C and D) Representative images of RGCs that were cultured alone or treated with SPARC (100 nM), hevin (30 nM), or both (30 nM hevin, 100 nM SPARC) and stained with antibodies against presynaptic [red; (C) bassoon or (D) synaptotagmin] and postsynaptic [green; (C) homer or (D) PSD95] markers. RGCs cultured alone or treated with SPARC (100 nM) did not have many colocalized synaptic puncta, whereas hevin induced formation of synapses (white arrows). Addition of hevin and SPARC at the same time led to the complete loss of the synaptogenic activity of hevin (Right), although pre- and postsynaptic clusters were still visible (see lower panels). In this condition, presynaptic synaptotagmin clusters were excluded from the cell body and proximal dendrites (white circle). (Scale bars: 30 μm.) Quantification of the fold changes in colocalized synaptic puncta number per cell (E) and synaptic density (F) for RGCs cultured alone, with astrocyte feeder layers, hevin (30 nM), SPARC (100 nM), hevin plus SPARC (30 nM and 100 nM, respectively), TSP1 (8 nM), and TSP1 plus SPARC (8 nM and 100 nM, respectively). Fold increase is calculated based on the number of synapses formed by RGCs cultured alone (mean synapse number for RGCs alone condition, 0.933 ± 0.27; *P < 0.05; n = 20 cells per condition; n.s., not significant; error bars indicate SEM).
Fig. 5.
Fig. 5.
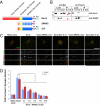
SPARC and C-terminal SLF of hevin antagonize hevin-induced synapse formation in a dose-dependent manner. (A) Schematic representation of domain structure of hevin, SPARC, and hevin truncation construct SLF. SPARC and hevin are composed of C-terminal SPARC-like (blue) and follistatin-like domains (yellow) and N-terminal acidic domains (red). SPARC and hevin are 60% identical at their C-terminal regions; however, they have low homology at the N terminus. The recombinant proteins used in this study contained tags (6-histidine tag and/or myc tag) for purification and immunoprecipitation. (B) Hevin does not interact with SPARC. Purified hevin was immunoprecipitated with an anti-myc tag antibody bound to Protein A/G beads (Pierce; Left). SPARC did not coimmunoprecipitate with hevin. Hevin was detected with goat anti-hevin polyclonal antibodies (Upper), and SPARC was detected with goat anti-SPARC polyclonal antibodies (R&D Systems; Lower). The experiment was repeated without anti-myc tag antibody (no primary; Right) as a negative control. H, purified hevin; S, purified SPARC; H+S, hevin and SPARC together. (C) Representative images of RGCs that were cultured alone or with hevin or with hevin plus SPARC or Hevin plus SLF (1:1 and 1:5 molar ratios), stained with the presynaptic marker bassoon (red) and the postsynaptic marker homer (green). Colocalized puncta in merged images represent synapses. (Scale bars: 30 μm.) (D) Quantification of the fold changes in colocalized synaptic puncta number per cell for RGCs cultured alone, with hevin (30 nM), and with hevin plus increasing concentrations of SPARC or SLF. Fold increase is calculated based on the number of synapses formed by RGCs cultured alone [mean synapse numbers for RGCs alone, 3.05 ± 0.48 (SPARC set) and 2.58 ± 0.70 (SLF set); *P < 0.05; n = 20 cells per condition; error bars indicate SEM).
Fig. 6.
Fig. 6.
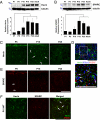
Expression of hevin and SPARC is developmentally regulated at the SC. (A) Upper: Representative Western blot analysis of hevin in SC lysates from P1, P5, P10, P15, P25, and adult mice. Lower: Tubulin as loading control. Graph shows quantification of relative expression levels of hevin protein in SC lysates. The expression levels were quantified first by normalization of the hevin signal to the tubulin signal, and subsequently by calculation of the ratio with respect to mean hevin signal level at P1 (n = 4 animals per age, four separate Western blots; *P < 0.05; error bars indicate SEM; Fig. S6 shows antibody characterization). (B) Upper: Representative Western blot of SPARC protein expression in SC lysates from P1, P5, P10, P15, P25, and adult mice. Lower: Tubulin as loading control. Graph shows quantification of relative expression levels of SPARC protein in SC lysates. The expression levels were quantified first by normalization of the SPARC signal to the tubulin signal, and subsequently by calculation of the ratio with respect to mean SPARC signal level at P1 (n = 4 animals per age, four separate Western blots; *P < 0.05; error bars indicate SEM; Fig. S6 shows antibody characterization). (C) Sagittal mouse brain sections from P5, P15, and P25 mice were stained for hevin with goat anti-hevin polyclonal antibodies (green; R&D Systems). Images are taken from SC. (Scale bars: 100 μm.) (D) High-magnification images from SC that was stained for hevin (12:155; green); a presynaptic marker that is specific for RGC axonal terminals, VGlut2 (blue; Synaptic Systems); and the postsynaptic marker that is specific for excitatory synapses, PSD95 (red; Zymed). (Scale bars: 25 μm.) (E) Sagittal mouse brain sections from P5, P15, and P25 mice were stained for SPARC with goat anti-SPARC polyclonal antibody (red; R&D Systems). Images are taken from SC. (Scale bars: 100 μm.) (F) Hevin and SPARC proteins are colocalized at P15 (SC). Upper: Sagittal P15 mouse brain sections were stained for hevin and SPARC with rat anti-hevin (12:155) and goat anti-SPARC antibodies (R&D Systems). Lower: Hevin and SPARC colocalize in the P15 mouse SC (arrows). (Scale bar: 100 μm.)
Fig. 7.
Fig. 7.
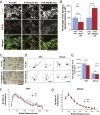
Hevin-null and SPARC-null mice display defects in retinocollicular synaptogenesis. (A) High-magnification images from synaptic staining of SC in WT, hevin-null (Hevin KO), and SPARC-null (SPARC KO) mice at P14. Top: Presynaptic marker VGlut2 staining. Arrowheads point to some of the VGlut2-positive presynaptic boutons made by RGC axons. Middle: Postsynaptic marker PSD95 staining. Bottom: Merged images of presynaptic VGlut2 (green) and postsynaptic PSD95 (red) immunostaining. Dashed circles outline some of the synapses. (Scale bar: 20 μm.) (B) Percent change in the number of retinocollicular synapses at P14 in Hevin-KO and SPARC-KO mice relative to WT mice. Synapses were quantified as the colocalization of the presynaptic marker VGlut2 and the postsynaptic marker PSD95 (n = 4 animals per genotype per age; 15 images per animal per age were analyzed; *P = 0.01; error bars indicate SEM; Fig. S7 provides further details). (C) Representative images of Golgi–Cox staining of SC regions in WT and Hevin-KO mouse brains at P14. (Scale bar:100 μm.) (D) Representative tracings for two major RGC target neuron types, WFII and stellate, from the WT and Hevin-KO mouse SC. (Scale bar: 100 μm.) (E) Convex hull analysis of WT and Hevin-KO WFII and stellate neurons showed no significant differences in dendritic area between genotypes (n = 22 for each neuron type; error bars indicate SEM). Sholl analysis of WT and Hevin-KO WFII (F) and stellate (G) neurons revealed no significant differences in dendritic complexity (n = 22 for each neuron type; error bars indicate SEM).
Fig. 8.
Fig. 8.
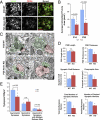
Hevin-null mice (KO) display defects in the morphology of retinocollicular synapses. (A) High-magnification images from synaptic staining of SC in WT (Upper) and hevin KO (Lower) mice at P25. Left: Presynaptic marker VGlut2 staining. Arrowheads point to some of the VGlut2-positive presynaptic boutons made by RGC axons. Middle: Postsynaptic marker PSD95 staining. Right: Merged images of presynaptic VGlut2 (green) and postsynaptic PSD95 (red) immunostaining. Dashed circles outline some of the synapses. (Scale bar: 20 μm.) (B) Quantification of average colocalized synaptic puncta area in WT versus hevin-KO mice at P14 and P25. (n = 4 animals per genotype per age; 15 images per animal) Average synaptic area (i.e., area of colocalized puncta) was significantly smaller in KO animals at ages P14 and P25 (*P < 0.01 and **P = 0.02; error bars indicate SEM). (C) Representative EM images of synapses from WT (Upper) and hevin-KO mouse SCs at P25. Green represents presynaptic site and red indicates postsynaptic site. White dashed lines outline presynaptic boutons. (Scale bar: 500 nm.) (D) Quantification of morphological synaptic parameters of the synapses of WT and hevin-KO mouse SCs: PSD length, PSD thickness, synaptic cleft distance, presynaptic bouton area, total number of synaptic vesicles, and number of docked synaptic vesicles at P25. (*P < 0.0001; n.s., not significant; error bars indicate SEM). (E) Quantification of synaptic density of asymmetric and symmetric synapses, and asymmetric synapses with multiple release sites, in WT and KO mouse SCs at P25. EM analysis showed that Hevin-null SC have 27% less asymmetric synaptic density compared with WT. In addition, density of asymmetric synapses with multiple presynaptic release sites is 34% less in hevin-null SC than WT. (*P < 0.02; n.s., not significant; error bars indicate SEM).
Fig. P1.
Fig. P1.
Astrocyte-secreted proteins hevin and SPARC control excitatory synaptogenesis in vitro and in vivo. Hevin induces the formation of synapses. SPARC is not synaptogenic, but specifically inhibits the synaptogenic function of hevin. Furthermore, we found that lack of hevin leads to defects in the recruitment of pre- and postsynaptic specializations at the RGC synapses in vitro and in vivo. These results identify hevin as a positive and SPARC as a negative regulator of synaptic development, and signify that, through regulation of relative levels of hevin and SPARC, astrocytes control the formation, maturation, and plasticity of synapses in the CNS.

Similar articles

Cited by

References

    1. Bolton MM, Eroglu C. Look who is weaving the neural web: Glial control of synapse formation. Curr Opin Neurobiol. 2009;19:491–497. - PubMed
    1. Eroglu C, Barres BA. Regulation of synaptic connectivity by glia. Nature. 2010;468:223–231. - PMC - PubMed
    1. Meyer-Franke A, Kaplan MR, Pfrieger FW, Barres BA. Characterization of the signaling interactions that promote the survival and growth of developing retinal ganglion cells in culture. Neuron. 1995;15:805–819. - PubMed
    1. Christopherson KS, et al. Thrombospondins are astrocyte-secreted proteins that promote CNS synaptogenesis. Cell. 2005;120:421–433. - PubMed
    1. Eroglu C, et al. Gabapentin receptor alpha2delta-1 is a neuronal thrombospondin receptor responsible for excitatory CNS synaptogenesis. Cell. 2009;139:380–392. - PMC - PubMed

Publication types

MeSH terms