

Transcriptional gene network inference from a massive dataset elucidates transcriptome organization and gene function
- PMID: 21785136
- PMCID: PMC3203605
- DOI: 10.1093/nar/gkr593
Transcriptional gene network inference from a massive dataset elucidates transcriptome organization and gene function
Abstract
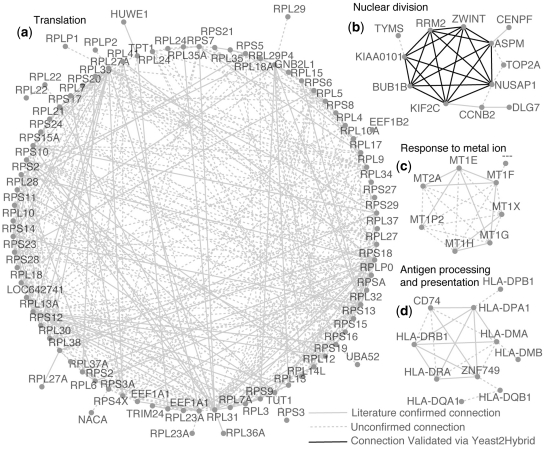
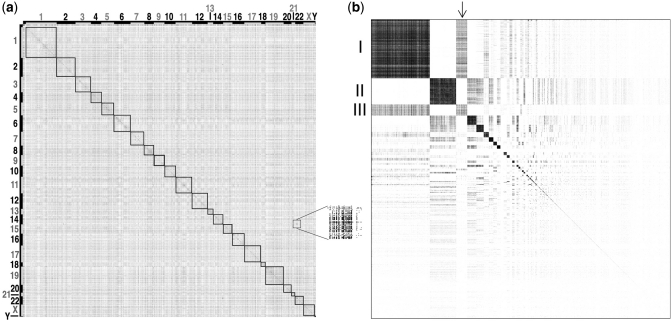
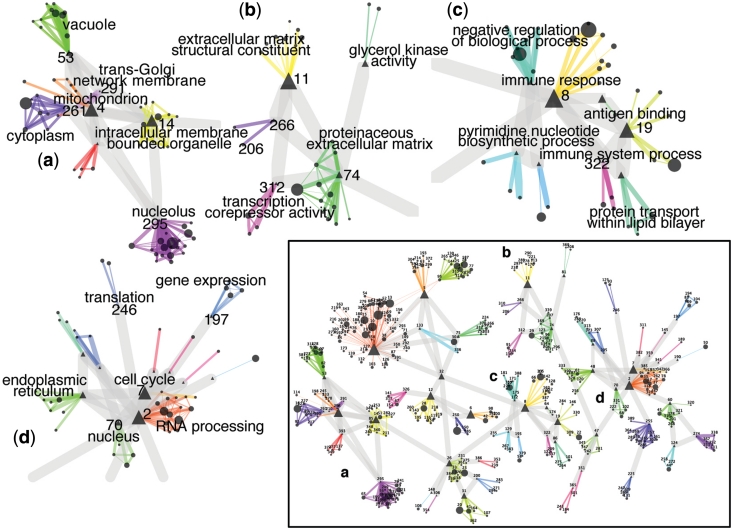
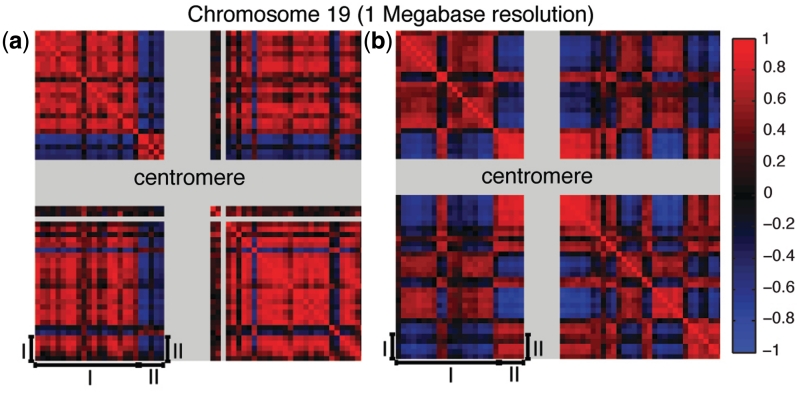
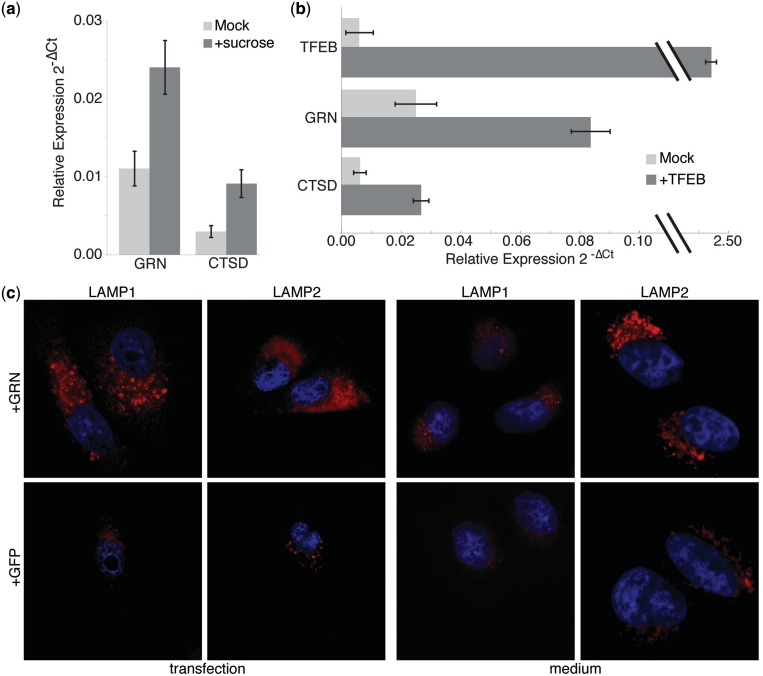
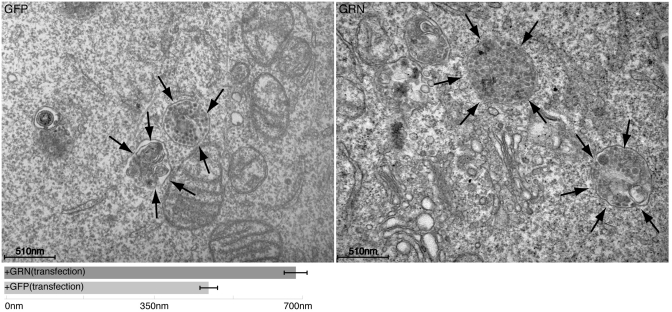
We collected a massive and heterogeneous dataset of 20 255 gene expression profiles (GEPs) from a variety of human samples and experimental conditions, as well as 8895 GEPs from mouse samples. We developed a mutual information (MI) reverse-engineering approach to quantify the extent to which the mRNA levels of two genes are related to each other across the dataset. The resulting networks consist of 4 817 629 connections among 20 255 transcripts in human and 14 461 095 connections among 45 101 transcripts in mouse, with a inter-species conservation of 12%. The inferred connections were compared against known interactions to assess their biological significance. We experimentally validated a subset of not previously described protein-protein interactions. We discovered co-expressed modules within the networks, consisting of genes strongly connected to each other, which carry out specific biological functions, and tend to be in physical proximity at the chromatin level in the nucleus. We show that the network can be used to predict the biological function and subcellular localization of a protein, and to elucidate the function of a disease gene. We experimentally verified that granulin precursor (GRN) gene, whose mutations cause frontotemporal lobar degeneration, is involved in lysosome function. We have developed an online tool to explore the human and mouse gene networks.
Figures
Similar articles
-
Early lysosomal maturation deficits in microglia triggers enhanced lysosomal activity in other brain cells of progranulin knockout mice.Mol Neurodegener. 2018 Sep 4;13(1):48. doi: 10.1186/s13024-018-0281-5. Mol Neurodegener. 2018. PMID: 30180904 Free PMC article.
-
The Evolution of the Secreted Regulatory Protein Progranulin.PLoS One. 2015 Aug 6;10(8):e0133749. doi: 10.1371/journal.pone.0133749. eCollection 2015. PLoS One. 2015. PMID: 26248158 Free PMC article.
-
Variations in the progranulin gene affect global gene expression in frontotemporal lobar degeneration.Hum Mol Genet. 2008 May 15;17(10):1349-62. doi: 10.1093/hmg/ddn023. Epub 2008 Jan 25. Hum Mol Genet. 2008. PMID: 18223198 Free PMC article.
-
Frontotemporal lobar degeneration: Pathogenesis, pathology and pathways to phenotype.Brain Pathol. 2017 Nov;27(6):723-736. doi: 10.1111/bpa.12486. Epub 2017 Mar 2. Brain Pathol. 2017. PMID: 28100023 Free PMC article. Review.
-
Progranulin: a proteolytically processed protein at the crossroads of inflammation and neurodegeneration.J Biol Chem. 2012 Sep 21;287(39):32298-306. doi: 10.1074/jbc.R112.399170. Epub 2012 Aug 2. J Biol Chem. 2012. PMID: 22859297 Free PMC article. Review.
Cited by
-
Statistical inference and reverse engineering of gene regulatory networks from observational expression data.Front Genet. 2012 Feb 3;3:8. doi: 10.3389/fgene.2012.00008. eCollection 2012. Front Genet. 2012. PMID: 22408642 Free PMC article.
-
Regulation of lysosomal trafficking of progranulin by sortilin and prosaposin.Brain Commun. 2022 Jan 4;4(1):fcab310. doi: 10.1093/braincomms/fcab310. eCollection 2022. Brain Commun. 2022. PMID: 35169707 Free PMC article.
-
Hierarchical dinucleotide distribution in genome along evolution and its effect on chromatin packing.Life Sci Alliance. 2021 Jun 24;4(8):e202101028. doi: 10.26508/lsa.202101028. Print 2021 Aug. Life Sci Alliance. 2021. PMID: 34168075 Free PMC article.
-
Impaired prosaposin lysosomal trafficking in frontotemporal lobar degeneration due to progranulin mutations.Nat Commun. 2017 May 25;8:15277. doi: 10.1038/ncomms15277. Nat Commun. 2017. PMID: 28541286 Free PMC article.
-
Evaluation of RNAi and CRISPR technologies by large-scale gene expression profiling in the Connectivity Map.PLoS Biol. 2017 Nov 30;15(11):e2003213. doi: 10.1371/journal.pbio.2003213. eCollection 2017 Nov. PLoS Biol. 2017. PMID: 29190685 Free PMC article.
References
-
- Basso K, Margolin AA, Stolovitzky G, Klein U, Dalla-Favera R, Califano A. Reverse engineering of regulatory networks in human B cells. Nat. Genet. 2005;37:382–390. - PubMed
Publication types
MeSH terms
Substances
Grants and funding
LinkOut - more resources
Full Text Sources
Other Literature Sources
Miscellaneous
