. 2011 Jul 22;146(2):247-61.
doi: 10.1016/j.cell.2011.06.013.

FMRP stalls ribosomal translocation on mRNAs linked to synaptic function and autism

Affiliations

FMRP stalls ribosomal translocation on mRNAs linked to synaptic function and autism

Jennifer C Darnell et al. Cell. .

Abstract

FMRP loss of function causes Fragile X syndrome (FXS) and autistic features. FMRP is a polyribosome-associated neuronal RNA-binding protein, suggesting that it plays a key role in regulating neuronal translation, but there has been little consensus regarding either its RNA targets or mechanism of action. Here, we use high-throughput sequencing of RNAs isolated by crosslinking immunoprecipitation (HITS-CLIP) to identify FMRP interactions with mouse brain polyribosomal mRNAs. FMRP interacts with the coding region of transcripts encoding pre- and postsynaptic proteins and transcripts implicated in autism spectrum disorders (ASD). We developed a brain polyribosome-programmed translation system, revealing that FMRP reversibly stalls ribosomes specifically on its target mRNAs. Our results suggest that loss of a translational brake on the synthesis of a subset of synaptic proteins contributes to FXS. In addition, they provide insight into the molecular basis of the cognitive and allied defects in FXS and ASD and suggest multiple targets for clinical intervention.


Conflict of interest statement

The authors declare no competing financial interests.

Figures
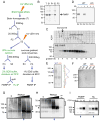
Figure 1
Figure 1. FMRP CLIP on purified mouse brain polyribosomes
(A) Schemes used for FMRP CLIP; steps specific to protocol 2 are indicated in green. Mouse brain post-mitochondrial supernatants (S2) were prepared as illustrated, and UV-crosslinked prior to loading on sucrose gradients for polyribosome purification. (B) Cell-equivalent aliquots of subcellular fractions from the purification steps indicated in (A) were analyzed by Western blotting for FMRP (with FMRP-specific ab17722); quantitation of three experimental replicates revealed 11.0% (standard deviation 1.4%) of FMRP is in P1. (C) The remaining ~90% of brain FMRP in S2 was applied to 20–50% sucrose gradients and gradient fractions analyzed by Western blot for FMRP. (D) Western blot comparison of the indicated fractions from (A) demonstrated that all the FMRP in pooled polyribosomes was pelleted at 300,000×g. (E) Autoradiogram of representative CLIP results from protocol 1. After dissociation of RNP complexes, samples were treated with RNAse T1, FMRP was IP’ed with either monoclonal or polyclonal antibodies, a 32P-labelled linker was ligated to the 3′ end of crosslinked RNA tags using T4 RNA ligase, and RNA protein-complexes run on denaturing PAGE, transferred to nitrocellulose and imaged by autoradiography. 32P-labeled RNA migrating at a modal size of 130kDa in IPs from WT but not Fmr1 KO brain (bracket) were taken for further workup; vertical line traces of each autoradiogram (blue (WT); red (KO); and green (non-crosslinked, not shown on autoradiogram) are shown to the right. (F) Following digestion of the radioactive RNA-protein complexes with proteinase K, a 5′ linker was added with T4 RNA ligase and products amplified by RT-PCR; product of the expected size, 60–100 nucleotides, was seen after 38 cycles (38X) from WT CLIP, but not from Fmr1 KO littermate CLIP. (G–H) To identify complexes crosslinked to RNA of an appropriate size using Protocol 2, aliquots of lysate were treated with a serial dilution of an RNAse A/T1 cocktail prior to IP of FMRP (G) or Hu (H). After 32P end-labeling with PNK, the RNA protein complexes were imaged by autoradiography. With no RNAse (0), complexes were of a wide range of sizes, most larger than desired, which progressively decreased as RNAse concentration increased, collapsing to bands close to the size of FMRP or Hu, as indicated (*). In the absence of crosslinking (no XL), only trace amounts of 32P-label were present. Protein-RNA conjugates were excised from the bracketed regions of the lanes indicated with blue arrows. (I) Final PCR products of CLIP tags of the expected size were obtained following 6–10 cycles of reamplification with sequencing primers, and the indicated samples (8 cycles) were used for Illumina sequencing. See also Table S2 and Figure S1.
Figure 2
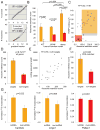
Figure 2. Distribution of FMRP binding sites in target mRNAs
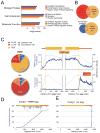
(A) The top 3 Gene Ontology (GO) terms enriched in FMRP target transcripts in indicated GO categories, by p-value. (B) Overlap between the postsynaptic proteome (PSP) of the Genes2Cognition (G2C) database, the presynaptic proteome, and FMRP targets. Venn diagrams are drawn to scale and show the overlap between FMRP target transcripts and the indicated proteomic categories, with the absolute number of evaluable transcripts and p-values shown. (C) Distribution of unique tags among FMRP or Hu target transcripts represented by pie chart or graphically (blue line; error bars represent standard deviation), normalized to the total number of FMRP or Hu target transcripts (grey line), showing a predominance of FMRP tags within the coding sequence (gold, CDS). In contrast, Hu tags were predominantly present within the 3′ UTR (red) or mapped within 10,000 nt downstream of annotated genes (pink, downstream 10K), a region rich in unannotated 3′ UTR sequences. (D–E), Distribution of the cumulative number of FMRP or Hu tags, as indicated, across the length of a representative transcript. Centg1 is a target of both RNABPs and illustrates the different mechanisms of transcript association (Hu has a specific binding site, while FMRP is evenly distributed in CDS) within one starting pool. The positions of individual tags are also plotted below the cartoon of the mRNA structure; colors represent independent experiments. See also Tables S3-S5 and Figure S2.
Figure 3
Figure 3. FMRP is associated with stalled polyribosomes in elongation-competent brain extracts
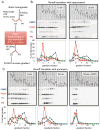
(A) Schematic of the preparation of the brain-programmed in vitro translation (IVTEBP) system, in which S1 supernatants supplemented with amino acids, ATP and rabbit reticulocyte lysate allow ribosomal runoff, detected by analysis on sucrose gradients and Western blot of polyribosome-associated RNA binding proteins. (B) gradient fractions before run-off (0 minutes, left panel), or after 20 minutes of elongation in the presence of hippuristanol (right panel). Western blot analysis (middle panels) and their quantitation (bottom graphs) were used to compare the distribution of FMRP (blue diamonds), PABP (orange triangles), neuronal Hu isoforms (green circles) and ribosomal protein P0 (red squares) in 20–50% sucrose gradients. A254 traces of total RNA distribution are shown (top panels) and gradient fractions indicated. (C) gradient fractions analyzed as in (B), from ribosomal run-offs performed before (left panels, 0 min) or after run-off in puromycin (middle panels, 20 min) or puromycin followed by 30 mM EDTA treatment to release all ribosomes (right panels). See also Figure S3.
Figure 4
Figure 4. Ribosomal stalling on FMRP target transcripts is relieved in three FMRP loss-of-function models
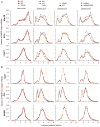
(A–B) FMRP target (A, Map1b, Lingo1, and Kif1a) or non-target (B, Hprt1, Glrb, and Slc35f1) mRNA distribution in each of 16 polyribosome sucrose gradient fractions was analyzed by qRT-PCR (see also Figure S4A). Prior to run-off (first column; CHX treated (“steady-state”) polyribosomes and reproduced in the second column, yellow line), no changes in mRNA distribution were evident between WT (black triangles), Fmr1 KO (red squares) or I304N knock-in (orange diamonds) brain polyribosomes. The same mRNAs were then analyzed in the IVTEBP system in puromycin to achieve run-off separating translocating from stalled ribosomes in three distinct FMRP loss-of-function systems (Fmr1 KO (second column, red circles versus WT in black), I304N (third column, orange diamonds versus WT in black), and from WT polyribosomes treated with kcRNA decoy to acutely disrupt FMRP polyribosome association (fourth column, red circles) compared with a non-functional kcRNA point mutant (kcRNAC50G, black)). Data are plotted as a fraction of total mRNA on the gradient; error bars represent standard deviation from three technical replicates. See also Figure S4.
Figure 5
Figure 5. Ribosome-weighted mRNA profiles for FMRP targets and non-targets
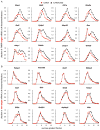
Ribosome-weighted graphs of kcRNA decoy data from Figure 4 are replotted, along with additional examples, weighting for the number of ribosomes in each fraction, as (fraction of mRNA) × (# ribosomes per fraction (from Figure 6A)). (A) Ribosome-weighted graphs of the top 12 (by RRS) of 21 FMRP target mRNA profiles. (B) Ribosome-weighted graphs of 12 FMRP non-target mRNAs. Data for all 39 transcripts is in Table S6. Error bars represent standard deviation from three technical replicates. See also Table S6 and Figure S5.
Figure 6
Figure 6. Quantitation of FMRP-mediated ribosome stalling
(A) Demonstration that the sucrose gradients used in the RRS calculations were linear. Top panel: The percent sucrose (w/w) measured in each gradient fraction using a refractometer is plotted by fraction number (R2= 0.99). Fractions 1–2 correspond to lysate. Bottom panel: Determination of the approximate number of ribosomes in each sucrose gradient fraction by extrapolation from those that can be directly counted, using linear regression analysis. 9 ribosomes per mRNA (black circles as a function of gradient fraction) were counted from A254 traces, and the best-fitting equation (R2=0.999) was used to extrapolate the number of ribosomes associated with mRNAs in each fraction for the remainder of the gradient (open circles, “predicted”), based on the linearity determined in the top panel. (B) Bar graphs plotting RRS scores in three different FMRP loss of function models (I304N, KO) for 9 target (gold) and 9 non-target (red) transcripts. For kcRNA experiments (“decoy”) data represents RRS scores for 21 targets and 16 non-targets). Significant differences are evident between targets and non-targets in all three systems, as well as a significantly greater effect of kcRNA decoy than either genetic FMRP loss of function model. Error bars depict the standard error of the mean. (C) A measure of the degree of FMRP binding to target mRNAs (chi-square score) compared with a functional assay (RRS, a measure of FMRP activity in retaining mRNA on polyribosomes after puromycin run-off) showed a significant correlation for 39 tested transcripts. Target transcripts (shaded gold) showed high chi-square and RRS scores relative to non-targets (shaded red), with some outliers and two targets deemed to be in a “grey zone” (see Table S6). Two transcripts, Arc and Gria1 mRNA, are in the “grey zone”. Arc falls just below the FDR <0.1 cutoff for the robust FMRP target list, likely in part because of very low abundance in resting mice (Table S6). Neither was included in statistical analyses of FMRP targets vs. nontargets in (D). (D) 20 FMRP targets and 16 non-targets show a significant difference in RRS (RRSAvg(target)= 148.1 +/− 14.6; RRSAvg(nontarget)= 58.3 +/− 8.9; p=9.7 × 10⁻⁶). This analysis includes every mRNA we have tested to date, except Arc and Gria1 (E) RRS is highly correlated with CDS length for FMRP targets (excluding an outlier, Bsn; CDS 11,829 nts). (F) Six FMRP targets and seven non-targets matched for length (in the 1–2 kbp window) show a significant difference in RRS (RRSAvg(target)= 93.7 +/− 17.6; RRSAvg(nontarget)= 44.8 +/− 8.6; p=0.040). (G) 35S-methionine labeled protein synthesized from two FMRP mRNA targets (Camk2a and Lingo1; gold shading) or one non-target (Pabpc1; red shading) in the IVTEBP system were compared by immunoprecipitation, SDS-PAGE and PhosphorImaging, normalizing against irrelevant bands in the IP and a CHX-treated control sample. Error bars represent s.e.m. in all panels, and P values were determined using a two-tailed Student’s t test. See also Table S6 and Figure S6.
Figure 7
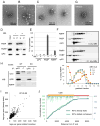
Figure 7. Characterization of the FMRP stalled complex
(A) Electron microscopic images of sucrose gradient fractions after puromycin-induced run-off of translocating ribosomes (as in Figure 3C). Negative staining with uranyl acetate revealed structures confirmed to be polyribosomes in (B). Scale bar is indicated. (B) Sucrose gradients were prepared from cerebellum of the Purkinje cell-specific Pcp2-promoter driven EGFP-tagged rpL10a BAC transgenic mice (Doyle et al., 2008; Heiman et al., 2008), and polyribosome fractions were treated with 6 nM gold-labeled anti-EGFP monoclonal antibody and processed for electron microscopy. Specific staining on clustered structures (white arrows) demonstrates that they correspond to polyribosomes. Only ~1% of polyribosomes showed labeling, consistent with the fact that whole cerebellum was used for analysis, and indicating specificity of the immunogold label. (C) Immunoelectron microscopic images of EGFP-FMRP association with stalled polyribosomal complexes after puromycin run-off in vivo in transfected cells. EGFP-FMRP was detected using 12 nm gold-labelling and antibodies against EGFP. 13.5% of polyribosomes were labeled in the presence of EGFP-FMRP (n=500) while only 0.02% of polyribosomes from EGFP-expressing cells were associated with gold (n=500). (D–E) Western blot (WB) analysis (D) and quantitation (E) of the micrococcal nuclease (MN) resistance of FMRP and ribosome co-sedimentation. Polyribosome-containing sucrose gradient fractions of mouse brain extracts were treated with (+) or without (−) 1000 U/ml MN, centrifuged through 15–20% sucrose, separating proteins as released supernatant (S) or heavy pelleted (P) particles, which were analyzed for the indicated proteins by WB. (F) Brain extracts were subjected to puromycin runoff, treated with the indicated concentration of MN, purified on 20–50% sucrose gradients and the indicated proteins analyzed by TCA precipitation and WB; only 25% of fractions 1–3 were precipitated to compensate for their high protein concentrations. Bottom panel: quantitation of FMRP from samples treated with the indicated concentrations of MN. Signals in lanes 1–3 were multiplied by 4 to compensate for the amount precipitated. (G) Samples from (A) were treated with 1000 U/ml MN prior to sucrose gradient purification and analysis by EM. (H) Samples prepared as in (G) from WT or Fmr1 KO brain were IP’d with anti-rpP0 or control (C; anti-Nova) antibodies and probed for the co-precipitation of the indicated proteins by WB. (I) Correlation of tags/transcript pooled from two biologic replicate FMRP CLIP experiments crosslinked from steady-state (CHX treated) versus stalled (puromycin run-off) brain polyribosomes. (J) Representative results from the experiments in (I) showing CLIP tag distribution on puromycin-resistant FMRP-stalled mRNA complexes (Kif1a; representative of 10 genes assessed; comparison of steady-state tags (blue) and stalled complexes (green)). Individual tags are shown below the mRNA cartoon (CDS is gold, 5′UTR blue, 3′UTR red). Biochemical purification, including co-IP and nuclease sensitivity was done in three independent experiments, EM and FMRP immuno-EM in 2–3 independent experiments, respectively, and CLIP on the stalled complex in two biologic replicates. See also Table S7 and Figure S7.

Similar articles

Cited by

References

    1. Aakalu G, Smith WB, Nguyen N, Jiang C, Schuman EM. Dynamic visualization of local protein synthesis in hippocampal neurons. Neuron. 2001;30:489–502. - PubMed
    1. Abul-Husn NS, Bushlin I, Moron JA, Jenkins SL, Dolios G, Wang R, Iyengar R, Ma’ayan A, Devi LA. Systems approach to explore components and interactions in the presynapse. Proteomics. 2009;9:3303–3315. - PMC - PubMed
    1. Baltimore D, Huang AS. Interaction of HeLa cell proteins with RNA. J Mol Biol. 1970;47:263–273. - PubMed
    1. Bassell GJ, Warren ST. Fragile X syndrome: loss of local mRNA regulation alters synaptic development and function. Neuron. 2008;60:201–214. - PMC - PubMed
    1. Basu SN, Kollu R, Banerjee-Basu S. AutDB: a gene reference resource for autism research. Nucleic Acids Res. 2009;37:D832–6. - PMC - PubMed

Publication types

Substances

Associated data