Protective HIV-specific CD8+ T cells evade Treg cell suppression
- PMID: 21765403
- PMCID: PMC3324980
- DOI: 10.1038/nm.2422
Protective HIV-specific CD8+ T cells evade Treg cell suppression
Erratum in
- Nat Med. 2011 Sep;17(9):1153
Abstract
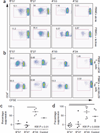
Specific human leukocyte antigens (HLAs), notably HLA-B*27 and HLA-B*57 allele groups, have long been associated with control of HIV-1. Although the majority of HIV-specific CD8(+) T cells lose proliferative capacity during chronic infection, T cells restricted by HLA-B*27 or HLA-B*57 allele groups do not. Here we show that CD8(+) T cells restricted by 'protective' HLA allele groups are not suppressed by T(reg) cells, whereas, within the same individual, T cells restricted by 'nonprotective' alleles are highly suppressed ex vivo. This differential sensitivity of HIV-specific CD8(+) T cells to T(reg) cell-mediated suppression correlates with their expression of the inhibitory receptor T cell immunoglobulin domain and mucin domain 3 (Tim-3) after stimulation with their cognate epitopes. Furthermore, we show that HLA-B*27- and HLA-B*57-restricted effectors also evade T(reg) cell-mediated suppression by directly killing T(reg) cells they encounter in a granzyme B (GzmB)-dependent manner. This study uncovers a previously unknown explanation for why HLA-B*27 and HLA-B*57 allele groups are associated with delayed HIV-1 disease progression.
Figures


Comment in
-
Killing the messenger to maintain control of HIV.Nat Med. 2011 Aug 4;17(8):927-8. doi: 10.1038/nm.2427. Nat Med. 2011. PMID: 21818087 No abstract available.
Similar articles
-
Killing the messenger to maintain control of HIV.Nat Med. 2011 Aug 4;17(8):927-8. doi: 10.1038/nm.2427. Nat Med. 2011. PMID: 21818087 No abstract available.
-
The expansion ability but not the quality of HIV-specific CD8(+) T cells is associated with protective human leucocyte antigen class I alleles in long-term non-progressors.Immunology. 2011 Nov;134(3):305-13. doi: 10.1111/j.1365-2567.2011.03490.x. Immunology. 2011. PMID: 21978000 Free PMC article.
-
Selective Upregulation of CTLA-4 on CD8+ T Cells Restricted by HLA-B*35Px Renders them to an Exhausted Phenotype in HIV-1 infection.PLoS Pathog. 2020 Aug 6;16(8):e1008696. doi: 10.1371/journal.ppat.1008696. eCollection 2020 Aug. PLoS Pathog. 2020. PMID: 32760139 Free PMC article.
-
HLA-B27-mediated protection in HIV and hepatitis C virus infection and pathogenesis in spondyloarthritis: two sides of the same coin?Curr Opin Rheumatol. 2013 Jul;25(4):426-33. doi: 10.1097/BOR.0b013e328362018f. Curr Opin Rheumatol. 2013. PMID: 23656712 Review.
-
[Protective role of HLA-B27 in HIV and hepatitis C virus infection].Dtsch Med Wochenschr. 2011 Feb;136(7):320-4. doi: 10.1055/s-0031-1272531. Epub 2011 Feb 7. Dtsch Med Wochenschr. 2011. PMID: 21302207 Review. German.
Cited by
-
Early Gag immunodominance of the HIV-specific T-cell response during acute/early infection is associated with higher CD8+ T-cell antiviral activity and correlates with preservation of the CD4+ T-cell compartment.J Virol. 2013 Jul;87(13):7445-62. doi: 10.1128/JVI.00865-13. Epub 2013 Apr 24. J Virol. 2013. PMID: 23616666 Free PMC article.
-
Superior control of HIV-1 replication by CD8+ T cells targeting conserved epitopes: implications for HIV vaccine design.PLoS One. 2013 May 31;8(5):e64405. doi: 10.1371/journal.pone.0064405. Print 2013. PLoS One. 2013. PMID: 23741326 Free PMC article.
-
Immunogenetics: Genome-Wide Association of Non-Progressive HIV and Viral Load Control: HLA Genes and Beyond.Front Immunol. 2013 May 27;4:118. doi: 10.3389/fimmu.2013.00118. eCollection 2013. Front Immunol. 2013. PMID: 23750159 Free PMC article.
-
Cell-Mediated Immunity in Elite Controllers Naturally Controlling HIV Viral Load.Front Immunol. 2013 Apr 9;4:86. doi: 10.3389/fimmu.2013.00086. eCollection 2013. Front Immunol. 2013. PMID: 23577012 Free PMC article.
-
Galectins and their ligands: negative regulators of anti-tumor immunity.Glycoconj J. 2012 Dec;29(8-9):619-25. doi: 10.1007/s10719-012-9379-0. Epub 2012 Apr 29. Glycoconj J. 2012. PMID: 22544342 Free PMC article. Review.
References
-
- McMichael AJ, Rowland-Jones SL. Cellular immune responses to HIV. Nature. 2001;410:980–987. - PubMed
-
- Kaslow RA, et al. Influence of combinations of human major histocompatibility complex genes on the course of HIV-1 infection. Nat. Med. 1996;2:405–411. - PubMed
-
- Carrington M, et al. HLA and HIV-1: heterozygote advantage and B*35-Cw*04 disadvantage. Science. 1999;283:1748–1752. - PubMed
-
- Carrington M, O’Brien SJ. The influence of HLA genotype on AIDS. Annu. Rev. Med. 2003;54:535–551. - PubMed
Publication types
MeSH terms
Substances
Grants and funding
- U01 AI046747-05/AI/NIAID NIH HHS/United States
- R37 AI042528-14/AI/NIAID NIH HHS/United States
- R21 AI089373-02/AI/NIAID NIH HHS/United States
- M01-RR-00037/RR/NCRR NIH HHS/United States
- P30 AI27757/AI/NIAID NIH HHS/United States
- P01 AI057005-05/AI/NIAID NIH HHS/United States
- M01 RR000037/RR/NCRR NIH HHS/United States
- U01 AI046725/AI/NIAID NIH HHS/United States
- P30 AI027757-19/AI/NIAID NIH HHS/United States
- U01 AI046725-05/AI/NIAID NIH HHS/United States
- U01 AI046747/AI/NIAID NIH HHS/United States
- AI 081060/AI/NIAID NIH HHS/United States
- P01 AI030731-20/AI/NIAID NIH HHS/United States
- P01 AI57005/AI/NIAID NIH HHS/United States
- R21 AI081060-02/AI/NIAID NIH HHS/United States
- R21 AI089373/AI/NIAID NIH HHS/United States
- R37 AI042528/AI/NIAID NIH HHS/United States
- R01 AI65328/AI/NIAID NIH HHS/United States
- U01 AI 46725/AI/NIAID NIH HHS/United States
- M01 RR000037-47/RR/NCRR NIH HHS/United States
- P01 AI030731/AI/NIAID NIH HHS/United States
- UL1 RR025014/RR/NCRR NIH HHS/United States
- AI30731/AI/NIAID NIH HHS/United States
- R21 AI081060/AI/NIAID NIH HHS/United States
- P01 AI057005/AI/NIAID NIH HHS/United States
- U01 AI4674/AI/NIAID NIH HHS/United States
- P30 AI027757/AI/NIAID NIH HHS/United States
- R01 AI065328-06/AI/NIAID NIH HHS/United States
- R01 AI042528/AI/NIAID NIH HHS/United States
- R01 AI065328/AI/NIAID NIH HHS/United States
LinkOut - more resources
Full Text Sources
Other Literature Sources
Medical
Research Materials

