. 2011 Jul 15;25(14):1470-5.
doi: 10.1101/gad.2046711.

Nuclear factor I/B is an oncogene in small cell lung cancer

Affiliations

Nuclear factor I/B is an oncogene in small cell lung cancer

Alison L Dooley et al. Genes Dev. .

Abstract

Small cell lung cancer (SCLC) is an aggressive cancer often diagnosed after it has metastasized. Despite the need to better understand this disease, SCLC remains poorly characterized at the molecular and genomic levels. Using a genetically engineered mouse model of SCLC driven by conditional deletion of Trp53 and Rb1 in the lung, we identified several frequent, high-magnitude focal DNA copy number alterations in SCLC. We uncovered amplification of a novel, oncogenic transcription factor, Nuclear factor I/B (Nfib), in the mouse SCLC model and in human SCLC. Functional studies indicate that NFIB regulates cell viability and proliferation during transformation.


Figures

Figure 1.
Figure 1.
Nfib is amplified in mSCLC tumors. (A) Log2 ratio of tumor to somatic DNA copy number across the whole genome of a mSCLC lymph node metastasis cell line. The X chromosome has a copy number ratio of 2 due to the male reference genome, while the sample was derived from a female mouse. (B) DNA copy number ratio of chromosome 4 of the same sample as in A. Interestingly, the region between the two focal amplifications is near diploid and contains the tumor suppressor gene Cdkn2a. Despite the well-known role of Cdkn2a in regulating p53 and Rb, which are already deleted in tumors, the fact that the copy number of this gene is kept low is consistent with this locus regulating other Rb family members (Schaffer et al. 2010). Copy number data are plotted as the tumor to somatic copy number ratio. (C) Integrated genome viewer (IGV) plot of the DNA copy number of position 79.5–84.5 Mb on chromosome 4. The bar indicates the log2 copy number ratio of tumor to somatic reference sample. The dotted line indicates the boundaries of the minimally conserved region. (T) Primary lung tumor; (Liv) liver metastasis; (LN) lymph node metastasis; (gray labels) tumor samples; (black labels) cell lines.
Figure 2.
Figure 2.
Nfib is expressed in mSCLC. (A) Nfib is amplified in tumor- and metastasis-derived cell lines. A DNA copy number ratio >1.2 was considered to be amplified, as determined by real-time PCR on genomic DNA. (B) Cell lines with increased copy number of the Nfib locus also have increased expression of Nfib. (C) FISH analysis on a lymph node metastasis confirming known amplification of Nfib from copy number analysis. The inset shows a cell with amplified Nfib. (D) Matching Nfib immunohistochemistry (IHC) on the same lymph node metastasis as in C, which has high Nfib expression. (E) FISH analysis of a lung tumor illustrating amplification of Nfib in a subset of tumor cells. The left inset illustrates a cell with normal Nfib copy number, and the right inset is a cell with amplified Nfib. (F) Matching Nfib IHC on the same lung tumor as in E, demonstrating increased Nfib expression in the region with Nfib amplification. Bar: C–F, 20 μm. (C,E) (Red) Nfib probe; (green) control chromosome 4qA1 probe; (blue) DAPI.
Figure 3.
Figure 3.
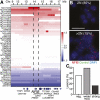
NFIB is amplified and expressed in human SCLC. (A) IGV plot of 46 human SCLC cell lines from position 11.1 to 17.2 Mb on human chromosome 9. The dotted line indicates the boundaries of the minimally conserved region. The bar indicates the log2 copy number ratio of tumor to somatic reference sample. (B) NFIB was amplified in human tissue samples, as detected by NFIB FISH. The top panel is a representative sample with normal NFIB copy number. The bottom panel is a representative sample with amplified NFIB. (Red) NFIB probe; (green) control chromosome 9 9q12 probe; (blue) DAPI. Bar, 10 μm. (C) Quantification of NFIB expression in human SCLC tissue samples as detected by IHC for NFIB.
Figure 4.
Figure 4.
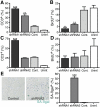
NFIB knockdown induces death and reduces proliferation in human SCLC. (A) NFIB knockdown increases the percentage of cleaved caspase 3 (CC3)-positive cells in the adherent cell line NCI-H446 by FACS compared with control (Cont.) infected cells. (B) Quantification of BrdU incorporation by FACS following NFIB knockdown in the same cell line as in A. (C) NFIB shRNA1 induces apoptosis, as observed in an increase in the percentage of CC3-positive cells in the adherent cell line NCI-H196 by FACS. (D) Reduced BrdU incorporation as detected by FACS following NFIB knockdown in the same cell line as in C. (E) Representative pictures of senescence-associated β-galactosidase staining (SA-βgal) in an adherent cell line, NCI-H196, following control (left) or NFIB (right) knockdown with shRNA2. Quantification of the SA-βgal staining is shown in the right panel. (**) P-value <0.005; (***) P-value <0.0005, compared with control.
Figure 5.
Figure 5.
Nfib is a novel oncogene in murine SCLC. (A) Quantification of the number of soft agar colonies in the uninfected or stably expressing Nfib cell line. The values represent the mean ± standard deviation of triplicate plates. (B) Growth curve of a primary tumor cell line, either uninfected or stably expressing Nfib. (C) Wild-type MEFs either uninfected or infected with Nfib-expressing viruses were plated at a low density and assayed for colony formation. Colonies were visualized using crystal violet and quantified. Values represent the mean ± standard error of the mean (SEM) of the total number of colonies in triplicate plates of both experiments using two different MEF preparations. (D) p53−/− MEFs either uninfected or infected with Nfib-expressing viruses were plated at a low density and assayed for colony formation. Colonies were visualized using crystal violet and quantified. Values represent the mean ± SEM of the total number of colonies in triplicate plates of both experiments using two different MEF preparations. (E) p53−/− MEFs either uninfected or infected with Nfib-expressing viruses were plated in soft agar and assayed for anchorage-independent colony formation. Colonies were visualized using crystal violet and quantified. Values represent the mean ± SEM of the number of colonies in nine camera views of triplicate plates in experiments using two different MEF preparations. (**) P-value <0.005; (***) P-value <0.0005.

Similar articles

Cited by

References

    1. Beroukhim R, Getz G, Nghiemphu L, Barretina J, Hsueh T, Linhart D, Vivanco I, Lee JC, Huang JH, Alexander S, et al. 2007. Assessing the significance of chromosomal aberrations in cancer: methodology and application to glioma. Proc Natl Acad Sci 104: 20007–20012 - PMC - PubMed
    1. Beroukhim R, Mermel CH, Porter D, Wei G, Raychaudhuri S, Donovan J, Barretina J, Boehm JS, Dobson J, Urashima M, et al. 2010. The landscape of somatic copy-number alteration across human cancers. Nature 463: 899–905 - PMC - PubMed
    1. Bhattacharjee A, Richards WG, Staunton J, Li C, Monti S, Vasa P, Ladd C, Beheshti J, Bueno R, Gillette M, et al. 2001. Classification of human lung carcinomas by mRNA expression profiling reveals distinct adenocarcinoma subclasses. Proc Natl Acad Sci 98: 13790–13795 - PMC - PubMed
    1. Campbell PJ, Stephens PJ, Pleasance ED, O'Meara S, Li H, Santarius T, Stebbings LA, Leroy C, Edkins S, Hardy C, et al. 2008. Identification of somatically acquired rearrangements in cancer using genome-wide massively parallel paired-end sequencing. Nat Genet 40: 722. - PMC - PubMed
    1. The Cancer Genome Atlas Research Network 2008. Comprehensive genomic characterization defines human glioblastoma genes and core pathways. Nature 455: 1061–1068 - PMC - PubMed

Publication types

Substances