

Microarray analyses of laser-captured hippocampus reveal distinct gray and white matter signatures associated with incipient Alzheimer's disease
- PMID: 21756998
- PMCID: PMC3163806
- DOI: 10.1016/j.jchemneu.2011.06.007
Microarray analyses of laser-captured hippocampus reveal distinct gray and white matter signatures associated with incipient Alzheimer's disease
Abstract
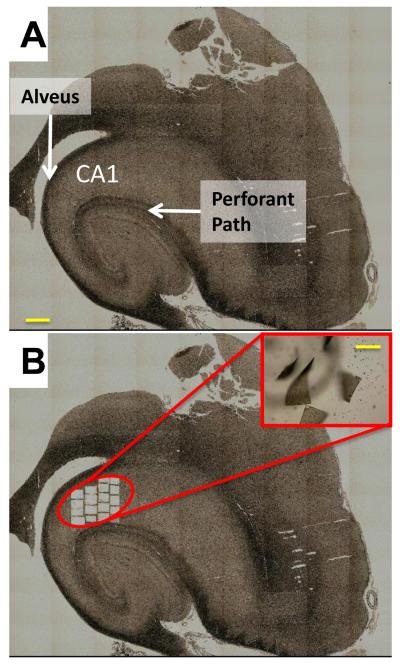
Alzheimer's disease (AD) is a devastating neurodegenerative disorder that threatens to reach epidemic proportions as our population ages. Although much research has examined molecular pathways associated with AD, relatively few such studies have focused on the disease's critical early stages. In a prior microarray study we correlated gene expression in hippocampus with degree of Alzheimer's disease and found close associations between upregulation of apparent glial transcription factor/epigenetic/tumor suppressor genes and incipient AD. The results suggested a new model in which AD pathology spreads along myelinated axons (Blalock et al., 2004). However, the microarray analyses were performed on RNA extracted from frozen hand-dissected hippocampal CA1 tissue blocks containing both gray and white matter, limiting the confidence with which transcriptional changes in gray matter could be distinguished from those in white matter. Here, we used laser capture microdissection (LCM) to exclude major white matter tracts while selectively collecting CA1 hippocampal gray matter from formalin-fixed, paraffin-embedded (FFPE) hippocampal sections of the same subjects assessed in our prior study. Microarray analyses of this gray matter-enriched tissue revealed many transcriptional changes similar to those seen in our past study and in studies by others, particularly for downregulated neuron-related genes. Additionally, the present analyses identified several previously undetected pathway alterations, including downregulation of molecules that stabilize ryanodine receptor Ca2+ release and upregulation of vasculature development. Conversely, we found a striking paucity of the upregulated changes in the putative glial and growth-related genes that had been strongly overrepresented in the prior mixed-tissue study. We conclude that FFPE tissue can be a reliable resource for microarray studies of brain tissue, that upregulation of growth-related epigenetic/transcription factors during incipient AD is predominantly localized in and around white matter (supporting our prior findings and model), and that novel alterations in vascular and ryanodine receptor-related pathways in gray matter are closely associated with incipient AD.
Copyright © 2011 Elsevier B.V. All rights reserved.
Figures
Similar articles
-
Incipient Alzheimer's disease: microarray correlation analyses reveal major transcriptional and tumor suppressor responses.Proc Natl Acad Sci U S A. 2004 Feb 17;101(7):2173-8. doi: 10.1073/pnas.0308512100. Epub 2004 Feb 9. Proc Natl Acad Sci U S A. 2004. PMID: 14769913 Free PMC article.
-
Gene expression levels assessed by CA1 pyramidal neuron and regional hippocampal dissections in Alzheimer's disease.Neurobiol Dis. 2012 Jan;45(1):99-107. doi: 10.1016/j.nbd.2011.07.013. Epub 2011 Jul 28. Neurobiol Dis. 2012. PMID: 21821124 Free PMC article.
-
Selective decline of neurotrophin and neurotrophin receptor genes within CA1 pyramidal neurons and hippocampus proper: Correlation with cognitive performance and neuropathology in mild cognitive impairment and Alzheimer's disease.Hippocampus. 2019 May;29(5):422-439. doi: 10.1002/hipo.22802. Epub 2017 Sep 27. Hippocampus. 2019. PMID: 28888073 Free PMC article.
-
Diffusion tensor imaging of white matter degeneration in Alzheimer's disease and mild cognitive impairment.Neuroscience. 2014 Sep 12;276:206-15. doi: 10.1016/j.neuroscience.2014.02.017. Epub 2014 Feb 27. Neuroscience. 2014. PMID: 24583036 Review.
-
Neuron-specific mitochondrial DNA deletion levels in sporadic Alzheimer's disease.Curr Alzheimer Res. 2013 Dec;10(10):1041-6. doi: 10.2174/15672050113106660166. Curr Alzheimer Res. 2013. PMID: 24156256 Review.
Cited by
-
Age-associated changes in gene expression in human brain and isolated neurons.Neurobiol Aging. 2013 Apr;34(4):1199-209. doi: 10.1016/j.neurobiolaging.2012.10.021. Epub 2012 Nov 21. Neurobiol Aging. 2013. PMID: 23177596 Free PMC article.
-
Age-dependent instability of mature neuronal fate in induced neurons from Alzheimer's patients.Cell Stem Cell. 2021 Sep 2;28(9):1533-1548.e6. doi: 10.1016/j.stem.2021.04.004. Epub 2021 Apr 27. Cell Stem Cell. 2021. PMID: 33910058 Free PMC article.
-
An integrated multi-omics approach identifies epigenetic alterations associated with Alzheimer's disease.Nat Genet. 2020 Oct;52(10):1024-1035. doi: 10.1038/s41588-020-0696-0. Epub 2020 Sep 28. Nat Genet. 2020. PMID: 32989324 Free PMC article.
-
A single-cell atlas of entorhinal cortex from individuals with Alzheimer's disease reveals cell-type-specific gene expression regulation.Nat Neurosci. 2019 Dec;22(12):2087-2097. doi: 10.1038/s41593-019-0539-4. Nat Neurosci. 2019. PMID: 31768052
-
A beginner's guide into curated analyses of open access datasets for biomarker discovery in neurodegeneration.Sci Data. 2023 Jul 6;10(1):432. doi: 10.1038/s41597-023-02338-1. Sci Data. 2023. PMID: 37414779 Free PMC article.
References
-
- Arendt T, Holzer M, Stobe A, Gartner U, Luth HJ, Bruckner MK, Ueberham U. Activated mitogenic signaling induces a process of dedifferentiation in Alzheimer’s disease that eventually results in cell death. Ann N Y Acad Sci. 2000;920:249–255. - PubMed
-
- Ashburner M, Ball CA, Blake JA, Botstein D, Butler H, Cherry JM, Davis AP, Dolinski K, Dwight SS, Eppig JT, Harris MA, Hill DP, Issel-Tarver L, Kasarskis A, Lewis S, Matese JC, Richardson JE, Ringwald M, Rubin GM, Sherlock G. Gene ontology: tool for the unification of biology. The Gene Ontology Consortium. Nat Genet. 2000;25:25–29. - PMC - PubMed
Publication types
MeSH terms
Substances
Grants and funding
- P30 AG028383-05/AG/NIA NIH HHS/United States
- AG004542/AG/NIA NIH HHS/United States
- S10 RR024704/RR/NCRR NIH HHS/United States
- AG028383/AG/NIA NIH HHS/United States
- P01 AG010836/AG/NIA NIH HHS/United States
- R37 AG004542/AG/NIA NIH HHS/United States
- R01 AG034605-03/AG/NIA NIH HHS/United States
- R01 AG037868/AG/NIA NIH HHS/United States
- S10 RR024704-01A1/RR/NCRR NIH HHS/United States
- P30 AG028383/AG/NIA NIH HHS/United States
- P01 AG010836-15/AG/NIA NIH HHS/United States
- R37 AG004542-21/AG/NIA NIH HHS/United States
- P01AG010836/AG/NIA NIH HHS/United States
- R01 AG034605/AG/NIA NIH HHS/United States
- S10RR024704/RR/NCRR NIH HHS/United States
- AG034605/AG/NIA NIH HHS/United States
LinkOut - more resources
Full Text Sources
Other Literature Sources
Medical
Molecular Biology Databases
Miscellaneous
