. 2011 Jul;23(7):2592-605.
doi: 10.1105/tpc.111.087338. Epub 2011 Jul 8.

Differential regulation of cellulose orientation at the inner and outer face of epidermal cells in the Arabidopsis hypocotyl

Affiliations

Differential regulation of cellulose orientation at the inner and outer face of epidermal cells in the Arabidopsis hypocotyl

Elizabeth Faris Crowell et al. Plant Cell. 2011 Jul.

Abstract

It is generally believed that cell elongation is regulated by cortical microtubules, which guide the movement of cellulose synthase complexes as they secrete cellulose microfibrils into the periplasmic space. Transversely oriented microtubules are predicted to direct the deposition of a parallel array of microfibrils, thus generating a mechanically anisotropic cell wall that will favor elongation and prevent radial swelling. Thus far, support for this model has been most convincingly demonstrated in filamentous algae. We found that in etiolated Arabidopsis thaliana hypocotyls, microtubules and cellulose synthase trajectories are transversely oriented on the outer surface of the epidermis for only a short period during growth and that anisotropic growth continues after this transverse organization is lost. Our data support previous findings that the outer epidermal wall is polylamellate in structure, with little or no anisotropy. By contrast, we observed perfectly transverse microtubules and microfibrils at the inner face of the epidermis during all stages of cell expansion. Experimental perturbation of cortical microtubule organization preferentially at the inner face led to increased radial swelling. Our study highlights the previously underestimated complexity of cortical microtubule organization in the shoot epidermis and underscores a role for the inner tissues in the regulation of growth anisotropy.


Figures
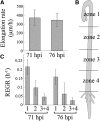
Figure 1.
Figure 1.
Characterization of Hypocotyl Elongation at 71 and 76 HAI. (A) Mean elongation rates for n ≥ 10 plants are represented; error bars indicate the sd. hpi, hours post induction. (B) The hypocotyl was divided into four equivalent zones as shown. In the upper quarter (zone 1), the cells elongate most rapidly. In the second quarter (zone 2), growth declines, and it reaches near zero in the bottom half of the hypocotyl (zones 3 and 4). (C) Mean REGRs for n ≥ 10 plants are represented for zones 1, 2, and 3 + 4 at each time point. Error bars indicate the sd. A gradient in REGRs is found for both time points, with zone 1 having the highest REGR.
Figure 2.
Figure 2.
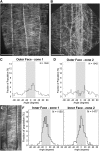
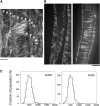
Microtubules at the Inner Face Align Independently of Those on the Outer Wall of Etiolated Hypocotyls. Quantifications were performed in zones 1 and 2 of etiolated hypocotyls at 71 HAI in GFP-TUA6–expressing plants. Bars = 10 μm. (A) A collar of synchronized cells with transversely oriented microtubules is found in zone 1. (B) Cells just below those pictured in (A) lack synchronization and have variably oriented microtubules. (C) and (D) Distributions of microtubule orientations at 71 HAI, in zone 1 on the outer epidermal face ([C], 34 cells from nine plants) and in zone 2 on the outer epidermal face ([D], 53 cells from 14 plants). The total number of microtubules measured (N) is indicated in the top right corner of each graph. Angles corresponding to the transverse orientation (22.5° ≥ θ > −22.5°) are highlighted in gray at the center of each distribution (see Supplemental Figure 2 online for the definition of orientations). In zone 2, no dominant peak is found at the transverse angles, and the distribution is relatively isotropic. (E) Transversely oriented microtubules on the inner face in zone 1 at 71 HAI. (F) The distributions of orientations of microtubules on the inner epidermal face in zones 1 and 2 (pooled measurements from 94 cells in 11 plants). The total number of microtubules measured (N) is indicated in the top right of each graph. Angles corresponding to the transverse orientation (22.5° ≥ θ > −22.5°) are highlighted in gray at the center of the graph.
Figure 3.
Figure 3.
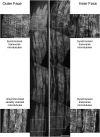
Only a Small Fraction of Cells Have Transversely Oriented Microtubules on the Outer Face, While All Elongating Cells Have Transversely Oriented Microtubules on the Inner Face. Images of a single representative GFP-TUA6–expressing plant showing microtubule orientations on the outer face (left panel) and inner face (right panel) throughout zone 1 at 71 HAI. The insets show enlarged views of the boxed regions. Bars = 10 μm.
Figure 4.
Figure 4.
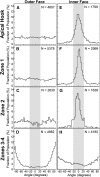
Microtubules Are Transverse on the Inner Face of Elongating Cells. The distribution of orientations of microtubules at 76 HAI on the outer epidermal face ([A] to [D]) and inner epidermal face ([E] to [H]; see Supplemental Figure 1 online). The distributions present pooled measurements of microtubules from multiple cells in multiple plants (outer face: n = 243 cells, n = 33 plants; inner face: n = 205 cells, n = 28 plants). The total number of microtubules measured (N) is indicated in the top right corner of each graph. The growth zones correspond to those outlined in Figure 1B. Microtubule orientations are shown for the apical hook region of zone 1 ([A] and [E]), the rapid elongation zone ([B] and [F]), zone 2 ([C] and [G]), and zones 3 and 4 ([D] and [H]). Angles corresponding to the transverse orientation (22.5° ≥ θ > −22.5°) are highlighted in gray at the center of each distribution (see Supplemental Figure 2 online for the definition of orientations).
Figure 5.
Figure 5.
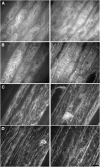
Microtubules Have Different Orientations on Opposite Faces of the Same Cells. Maximum projected z-stacks showing GFP-TUA6–labeled microtubules on the outer epidermal face (left panel) and inner epidermal face (right panel) of the same cells at 76 HAI. Images acquired in the apical hook (A), zone 1 (B), zone 3 (C), and zone 4 (D) are shown. The transverse microtubule alignment on the inner face is progressively lost as the cells cease elongating ([C] and [D], right panels). Images are representative of n > 50 hypocotyls sampled. Bar = 10 μm.
Figure 6.
Figure 6.
The Same Microtubules Can Extend from the Outer to the Inner Face and Have Similar Dynamics. (A) Montage of maximum and orthogonal projections of a confocal z-stack showing GFP-TUA6–labeled microtubules on the inner face, side region, and outer face of one epidermal cell in zone 3. The arrowheads indicate example microtubule bundles that extend from the inner face to the outer face of the cell, with a sudden change in orientation on the outer face (right side of image). Other unmarked examples are also visible. (B) Maximum projected 5-min time series acquired at a 20-s interval showing the trajectories of EB1-GFP comets following the polymerizing ends of microtubules. EB1-GFP trajectories on the outer face (left panel) and inner face (right panel) of the same epidermal cell. Bars = 10 μm. (C) Velocity distribution of EB1-GFP comets on the outer and inner faces (outer: n = 1119; inner: n = 1825).
Figure 7.
Figure 7.
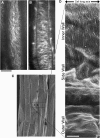
Cellulose Synthase Trajectories and Cellulose Microfibrils Are Also Oriented Transversely on the Inner Face. (A) and (B) Representative average projected 10-min time series acquired at a 30-s interval showing the trajectories of GFP-CESA3–labeled CSCs in the same cell in zone 1 on the outer (A) and inner (B) face. On the inner face, the CSCs migrate along strictly transverse trajectories (B). Bar = 5 μm. (C) Low-magnification scanning electron microscopy image of an etiolated hypocotyl, showing an epidermal cell wall that has torn open. The numbers indicate positions subsequently analyzed at higher magnification. (D) Montage of several high magnification images in the boxed region in (C), showing the gradual change in cellulose microfibril orientation and texture from the outer wall to the inner wall. Bar = 500 nm.
Figure 8.
Figure 8.
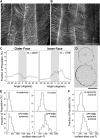
Microtubule Orientation Is Perturbed on the Inner Epidermal Face of GFP-MBD–Expressing Plants. (A) and (B) Extended depth of field images of GFP-MBD–labeled microtubules on the outer (A) and inner (B) epidermal face of the same cells in zone 1. The microtubules are abnormally oriented in oblique angles on the inner face ([B]; compare with Figure 5B, right panel). Bar = 10 μm. (C) The distribution of orientations of microtubules on the outer and inner epidermal face in zone 1 of GFP-MBD–expressing plants at 76 HAI (pooled measurements of 78 cells from three plants). The total number of microtubules measured (N) is indicated in the top right of each graph. Angles corresponding to the transverse orientation (22.5° ≥ θ > −22.5°) are highlighted in gray at the center of each distribution. The microtubules on the inner face of the GFP-MBD line are less parallel and more obliquely oriented than in the GFP-TUA6 line (cf. with Figure 4F). (D) Photographs of hypocotyl cross sections from a Wassilewskija wild-type (top) and GFP-MBD (bottom) line. The asterisk shows an epidermal cell facing an anticlinal cortical wall. Bar = 100 μm. (E) Distributions of epidermal and cortical cell surface areas measured in the Wassilewskija wild-type (wt)and GFP-MBD line (n = 75 to 160 cells, n = 4 plants). Note the significant overall increase in cortical cell surface area in the GFP-MBD line. (F) Distributions of epidermal cell surface areas for the subpopulation facing anticlinal inner walls (n = 67 cells, n = 4 plants). This subpopulation of epidermal cells undergoes radial swelling in the GFP-MBD line.

Similar articles

Cited by

References

    1. Abe H., Funada R., Ohtani J., Fukazawa K. (1995). Changes in the arrangement of microtubules and microfibrils in differentiating conifer tracheids during the expansion of cells. Ann. Bot. (Lond.) 75: 305–310
    1. Anderson C.T., Carroll A., Akhmetova L., Somerville C. (2010). Real-time imaging of cellulose reorientation during cell wall expansion in Arabidopsis roots. Plant Physiol. 152: 787–796 - PMC - PubMed
    1. Barton D.A., Overall R.L. (2010). Cryofixation rapidly preserves cytoskeletal arrays of leaf epidermal cells revealing microtubule co-alignments between neighbouring cells and adjacent actin and microtubule bundles in the cortex. J. Microsc. 237: 79–88 - PubMed
    1. Baskin T.I. (2001). On the alignment of cellulose microfibrils by cortical microtubules: A review and a model. Protoplasma 215: 150–171 - PubMed
    1. Baskin T.I. (2005). Anisotropic expansion of the plant cell wall. Annu. Rev. Cell Dev. Biol. 21: 203–222 - PubMed

Publication types

MeSH terms

LinkOut - more resources