CXCL12/CXCR4 blockade induces multimodal antitumor effects that prolong survival in an immunocompetent mouse model of ovarian cancer
- PMID: 21742774
- PMCID: PMC3959864
- DOI: 10.1158/0008-5472.CAN-10-3143
CXCL12/CXCR4 blockade induces multimodal antitumor effects that prolong survival in an immunocompetent mouse model of ovarian cancer
Abstract
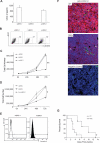
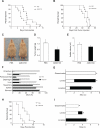
The chemokine CXCL12 and its receptor CXCR4 are expressed widely in human cancers, including ovarian cancer, in which they are associated with disease progression at the levels of tumor cell proliferation, invasion, and angiogenesis. Here, we used an immunocompetent mouse model of intraperitoneal papillary epithelial ovarian cancer to show that modulation of the CXCL12/CXCR4 axis in ovarian cancer has multimodal effects on tumor pathogenesis associated with induction of antitumor immunity. siRNA-mediated knockdown of CXCL12 in BR5-1 cells that constitutively express CXCL12 and CXCR4 reduced cell proliferation in vitro, and tumor growth in vivo. Similarly, treatment of BR5-1-derived tumors with AMD3100, a selective CXCR4 antagonist, resulted in increased tumor apoptosis and necrosis, reduction in intraperitoneal dissemination, and selective reduction of intratumoral FoxP3(+) regulatory T cells (Treg). Compared with controls, CXCR4 blockade greatly increased T-cell-mediated antitumor immune responses, conferring a significant survival advantage to AMD3100-treated mice. In addition, the selective effect of CXCR4 antagonism on intratumoral Tregs was associated with both higher CXCR4 expression and increased chemotactic responses to CXCL12, a finding that was also confirmed in a melanoma model. Together, our findings reinforce the concept of a critical role for the CXCL12/CXCR4 axis in ovarian cancer pathogenesis, and they offer a definitive preclinical validation of CXCR4 as a therapeutic target in this disease.
Figures


Similar articles
-
Role of CXCL12-CXCR4 axis in ovarian cancer metastasis and CXCL12-CXCR4 blockade with AMD3100 suppresses tumor cell migration and invasion in vitro.J Cell Physiol. 2019 Apr;234(4):3897-3909. doi: 10.1002/jcp.27163. Epub 2018 Sep 7. J Cell Physiol. 2019. Retraction in: J Cell Physiol. 2022 Mar;237(3):2005. doi: 10.1002/jcp.30517 PMID: 30191987 Retracted.
-
Dual blockade of CXCL12-CXCR4 and PD-1-PD-L1 pathways prolongs survival of ovarian tumor-bearing mice by prevention of immunosuppression in the tumor microenvironment.FASEB J. 2019 May;33(5):6596-6608. doi: 10.1096/fj.201802067RR. Epub 2019 Feb 25. FASEB J. 2019. PMID: 30802149 Free PMC article.
-
CXCL12/CXCR4 blockade by oncolytic virotherapy inhibits ovarian cancer growth by decreasing immunosuppression and targeting cancer-initiating cells.J Immunol. 2014 Nov 15;193(10):5327-37. doi: 10.4049/jimmunol.1400201. Epub 2014 Oct 15. J Immunol. 2014. PMID: 25320277 Free PMC article.
-
The CXCL12-CXCR4/CXCR7 axis as a mechanism of immune resistance in gastrointestinal malignancies.Semin Cancer Biol. 2020 Oct;65:176-188. doi: 10.1016/j.semcancer.2019.12.007. Epub 2019 Dec 23. Semin Cancer Biol. 2020. PMID: 31874281 Review.
-
Role of CXCL12/CXCR4 signaling axis in pancreatic cancer.Chin Med J (Engl). 2013;126(17):3371-4. Chin Med J (Engl). 2013. PMID: 24033967 Review.
Cited by
-
Targeted immune therapy of ovarian cancer.Cancer Metastasis Rev. 2015 Mar;34(1):53-74. doi: 10.1007/s10555-014-9540-2. Cancer Metastasis Rev. 2015. Retraction in: Cancer Metastasis Rev. 2016 Sep;35(3):489. doi: 10.1007/s10555-016-9627-z PMID: 25544369 Free PMC article. Retracted. Review.
-
Bidirectional crosstalk between therapeutic cancer vaccines and the tumor microenvironment: Beyond tumor antigens.Fundam Res. 2022 Mar 26;3(6):1005-1024. doi: 10.1016/j.fmre.2022.03.009. eCollection 2023 Nov. Fundam Res. 2022. PMID: 38933006 Free PMC article. Review.
-
Tumour inhibitory activity on pancreatic cancer by bispecific nanobody targeting PD-L1 and CXCR4.BMC Cancer. 2022 Oct 25;22(1):1092. doi: 10.1186/s12885-022-10165-7. BMC Cancer. 2022. PMID: 36284271 Free PMC article.
-
Implications of chemokine receptors and inflammatory lipids in cancer.Immunotargets Ther. 2013 Dec 24;3:9-18. doi: 10.2147/ITT.S32049. eCollection 2014. Immunotargets Ther. 2013. PMID: 27471696 Free PMC article. Review.
-
Durable response of glioblastoma to adjuvant therapy consisting of temozolomide and a weekly dose of AMD3100 (plerixafor), a CXCR4 inhibitor, together with lapatinib, metformin and niacinamide.Oncoscience. 2016 Jun 11;3(5-6):156-63. doi: 10.18632/oncoscience.311. eCollection 2016. Oncoscience. 2016. PMID: 27489862 Free PMC article.
References
-
- Milliken D, Scotton C, Raju S, Balkwill F, Wilson J. Analysis of chemokines and chemokine receptor expression in ovarian cancer ascites. Clin Cancer Res. 2002;8:1108–14. - PubMed
-
- Ochsenbein AF. Principles of tumor immunosurveillance and implications for immunotherapy. Cancer Gene Ther. 2002;9:1043–55. - PubMed
Publication types
MeSH terms
Substances
Grants and funding
LinkOut - more resources
Full Text Sources
Other Literature Sources
Medical

