. 2011 Sep;22(17):3010-21.
doi: 10.1091/mbc.E11-02-0094. Epub 2011 Jul 7.

Calcium signals and calpain-dependent necrosis are essential for release of coxsackievirus B from polarized intestinal epithelial cells

Affiliations

Calcium signals and calpain-dependent necrosis are essential for release of coxsackievirus B from polarized intestinal epithelial cells

Rebecca A Bozym et al. Mol Biol Cell. 2011 Sep.

Abstract

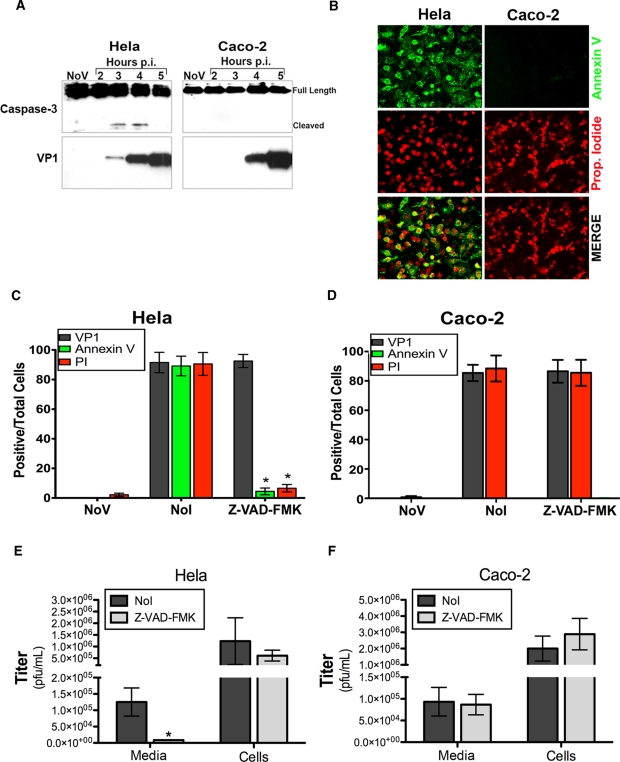
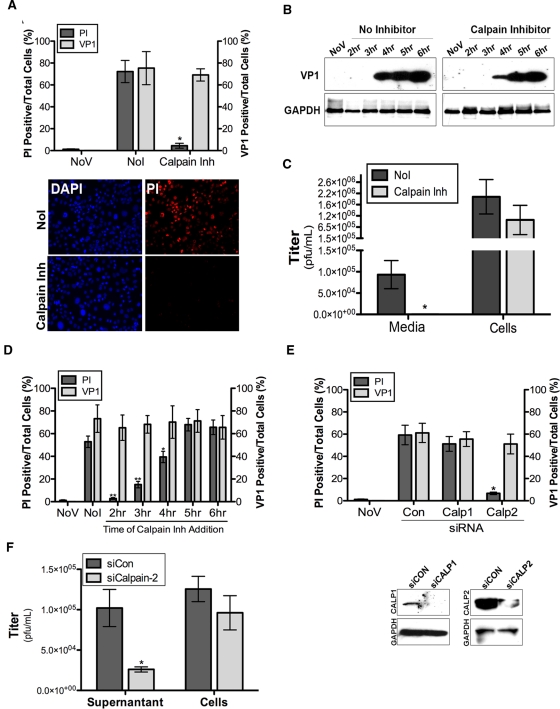
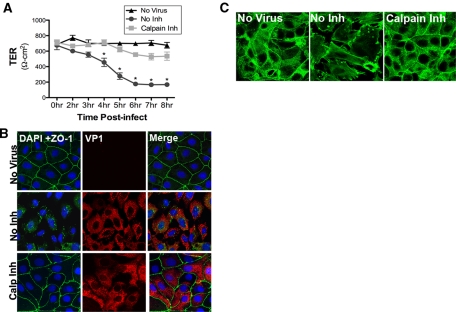
Coxsackievirus B (CVB), a member of the enterovirus family, targets the polarized epithelial cells lining the intestinal tract early in infection. Although the polarized epithelium functions as a protective barrier, this barrier is likely exploited by CVB to promote viral entry and subsequent egress. Here we show that, in contrast to nonpolarized cells, CVB-infected polarized intestinal Caco-2 cells undergo nonapoptotic necrotic cell death triggered by inositol 1,4,5-trisphosphate receptor-dependent calcium release. We further show that CVB-induced cellular necrosis depends on the Ca(2+)-activated protease calpain-2 and that this protease is involved in CVB-induced disruption of the junctional complex and rearrangements of the actin cytoskeleton. Our study illustrates the cell signaling pathways hijacked by CVB, and perhaps other viral pathogens, to promote their replication and spread in polarized cell types.


Figures

FIGURE 1:
FIGURE 1:
Caco-2 cells infected with CVB do not undergo apoptosis. (A) Western blot analysis of caspase-3 (top) and VP1 (bottom) in HeLa and Caco-2 cells at the indicated times following CVB infection. (B) Annexin V (green) binding and PI (red) uptake in HeLa (left) or Caco-2 (right) cells infected with CVB for 8 h. (C and D) Quantification of immunofluorescence images of Annexin V binding, PI uptake, and infection (as determined by VP1 immunofluorescence) in CVB-infected HeLa (C) or Caco-2 (D) cells incubated with no inhibitor (NoI), with the caspase-3 inhibitor Z-VAD-FMK, or in uninfected (NoV) controls. Data are presented as the percentage of positive cells divided by the total number of cells. (E and F) Virus titers (shown as PFU/ml) determined by plaque assays from the medium vs. lysed cells of HeLa (E) or Caco-2 (F) cells infected with CVB for 12 h in the absence (no inhibitor, NoI) or presence of Z-VAD-FMK. In (C–F), data are presented as mean ± SD from experiments performed in triplicate a minimum of three times, *p < 0.001.
FIGURE 2:
FIGURE 2:
Calpains mediate CVB-induced necrosis in Caco-2 cells. (A) PI uptake and VP1 staining in Caco-2 cells infected with CVB for 8 h in the absence of inhibitor (NoI), in the presence of the calpain inhibitor Z-Val-Phe-CHO, or in uninfected (NoV) controls. Representative images of DAPI (blue) and PI (red) are shown. (B) Western blot analysis for VP1 in Caco-2 cells infected with CVB for the indicated time in the absence of inhibitor (left) or in the presence of Z-Val-Phe-CHO (right). GAPDH is shown at bottom as a loading control. (C) Virus titers (shown as PFU/ml) determined by plaque assays from the medium vs. lysed cells of Caco-2 cells infected with CVB for 12 h in the absence (no inhibitor, NoI) or presence of Z-Val-Phe-CHO. (D) Percent PI uptake and VP1 staining in Caco-2 cells infected with CVB in the absence (NoI) or presence of Z-Val-Phe-CHO added to cells at the indicated times p.i. or in uninfected (NoV) controls. Shown are the percentages of PI- or VP1-positive cells divided by the total number of cells. (E) Percent PI uptake and VP1 staining in Caco-2 cells transfected with control (Con) or calpain-1 or -2 siRNAs (by Amaxa nucleofection) and infected with CVB (for 8 h) 48 h posttransfection. Shown are the percentages of PI- or VP1-positive cells. Bottom, immunoblot analysis for calpain-1 (left) or -2 (right) in siRNA-transfected cells. GAPDH is included as a loading control. (F) Virus titers (shown as PFU/ml) determined by plaque assays from the medium vs. lysed cells of Caco-2 cells transfected with control siRNA or calpain-2 siRNA (by Amaxa nucleofection) and infected with CVB for 12 h. In (C–F), data are presented as mean ± SD from experiments performed in triplicate a minimum of three times, *p < 0.05 and **p < 0.001.
FIGURE 3:
FIGURE 3:
Loss of junctional integrity in CVB-infected Caco-2 cells. (A) TER measurements in Caco-2 cells infected with CVB in the absence (No Inh) or presence of Z-Val-Phe-CHO (Calpain Inh) for the indicated times or in uninfected (no virus) controls. (B) Confocal micrographs of Caco-2 cells infected with CVB for 8 h in the absence (No Inh) or presence of Z-Val-Phe-CHO and stained for DAPI (blue), ZO-1 (green), and VP1 (red) compared with uninfected (no virus) controls. (C) Immunofluorescence microscopy staining for actin in Caco-2 cells infected with CVB for 8 h in the absence (No Inh) or presence of Z-Val-Phe-CHO (Calpain Inh) or in uninfected controls.
FIGURE 4:
FIGURE 4:
Several junction-associated components are modulated by calpains during CVB infection. (A) Western blot analysis for the indicated proteins from lysates of Caco-2 cells infected with CVB for 12 h in the absence (NoI) or presence of Z-Val-Phe-CHO (CalpI) or in uninfected controls (NoV). GAPDH is shown as a loading control, and VP1 production is shown as a control for infection levels. Arrow (gray) denotes a cleaved occludin fragment. (B) Western blot analysis for occludin, E-cadherin, and ZO-1 from lysates of Caco-2 cells infected with CVB for the indicated times. VP1 production is shown as a control for infection levels. Arrow (gray) denotes a cleaved occludin fragment. (C) Confocal micrographs of Caco-2 cells stained for VP1 (blue), occludin (green), and ZO-1 (red) in the absence of virus or in cells infected with CVB for 8 h in the absence or presence of calpain inhibitor Z-Val-Phe-CHO. (D) Confocal micrographs of Caco-2 cells stained for DAPI (blue), occludin (green), or calpain-2 (red) in the absence or presence of CVB 3 h p.i.
FIGURE 5:
FIGURE 5:
Pharmacological inhibitors of calcium homeostasis or signaling prevent CVB-induced necrosis in Caco-2 cells. (A) PI uptake and VP1 staining (shown as percent positive staining divided by the total number of cells) in Caco-2 cells infected with CVB for 8 h in the absence of inhibitor (NoI) or in the presence of the indicated inhibitors [Bapta-AM, caffeine (Caff), CPA, CSA, or thapsigargin (Thap)] or in uninfected (NoV) controls. (B) PI uptake and VP1 staining (shown as percent positive staining divided by the total number of cells) in Caco-2 cells infected with CVB for 8 h in the absence of inhibitor (NoI) or in the presence of the indicated inhibitors [2-APB or U73122 (U7)] or in uninfected (NoV) controls. (C) Immunofluorescence microscopy for VP1 (green) and occludin (red) in Caco-2 cells infected with CVB for 8 h in the absence (NoI) or presence of thapsigargin (Thap), or in uninfected (NoV) controls. (D) Virus titers (shown as PFU/ml) determined by plaque assays from the medium vs. lysed cells of Caco-2 cells infected with CVB for 12 h in the absence [no inhibitor, NoI] or presence of thapsigargin (thap), U73122, or 2-APB. (E) Percent PI uptake in Caco-2 cells infected with CVB for 8 h in the absence (NoI) or presence of thapsigargin (thap), U73122, or 2-APB added to cells at the indicated times p.i., or in uninfected (NoV) controls. Shown are the percentages of PI-positive cells divided by the total number of cells. Data in (A, B, D, and E) are presented as mean ± SD from experiments performed in triplicate a minimum of three times, *p < 0.001.
FIGURE 6:
FIGURE 6:
[Ca2+]i stores are depleted between 2 and 3 h following CVB infection of Caco-2 cells. (A) Fluorescence intensity ratio of Fura-2 in response to thapsigargin (black arrow) in Caco-2 cells infected with CVB for 3 h or in uninfected (No Virus) controls. Shown are representative traces per condition. (B) Representative images of Fura-2 AM–loaded Caco-2 cells from (A). Time of thapsigargin addition is represented by a black arrow. Images are pseudocolored for visual assessment with dark blue (low Ca2+) and red (high Ca2+). (C) Fluorescence intensity ratio over the course of 1 h in Caco-2 cells infected with CVB for 2 h (2–3 h p.i.) or in uninfected controls. (D) Change in intensity ratio from traces shown in (C). Data in (D) are presented as mean ± SD from experiments performed in triplicate a minimum of three times, *p < 0.0001.
FIGURE 7:
FIGURE 7:
PLC activity and IP3R expression are required for CVB-induced alterations in Ca2+. (A) Fluorescence intensity ratio over time in response to thapsigargin (black arrow) in Caco-2 cells infected with CVB for 3 h p.i. in the absence (NoI) or presence of 2-APB or U73122 or in uninfected (NoV) controls. (B) Overall change in fluorescence intensity ratio from traces shown in (A). (C) Fluorescence intensity ratio over time in response to thapsigargin (black arrow) in Caco-2 cells cotransfected with control or IP3R-1 and -3 siRNAs (using Hiperfect) and infected (48 h posttransfection) with CVB for 3 h. (D) Overall change in fluorescence intensity ratio from traces shown in (C). (E) Virus titers (shown as PFU/ml) determined by plaque assays from the medium vs. lysed cells of Caco-2 cells transfected with control (CON) or IP3R-1 and -3 siRNAs (by Amaxa nucleofection) and infected with CVB for 12 h. Data in (B), (D), and (E) are presented as mean ± SD from experiments performed in triplicate a minimum of three times, *p < 0.001. (F) Western blot analysis for IP3R-1 and -3 expression in Caco-2 cells transfected with control siRNA or siRNAs against IP3R-1 or -3. GAPDH is shown as a loading control.

Similar articles

Cited by

References

    1. Agol VI, Belov GA, Bienz K, Egger D, Kolesnikova MS, Raikhlin NT, Romanova LI, Smirnova EA, Tolskaya EA. Two types of death of poliovirus-infected cells: caspase involvement in the apoptosis but not cytopathic effect. Virology. 1998;252:343–353. - PubMed
    1. Barco A, Feduchi E, Carrasco L. Poliovirus protease 3C(pro) kills cells by apoptosis. Virology. 2000;266:352–360. - PubMed
    1. Benetti R, Copetti T, Dell'Orso S, Melloni E, Brancolini C, Monte M, Schneider C. The calpain system is involved in the constitutive regulation of beta-catenin signaling functions. J Biol Chem. 2005;280:22070–22080. - PubMed
    1. Bozym RA, Morosky SA, Kim KS, Cherry S, Coyne CB. Release of intracellular calcium stores facilitates coxsackievirus entry into polarized endothelial cells. PLoS Pathog. 2010;6 - PMC - PubMed
    1. Cardenas C, et al. Essential regulation of cell bioenergetics by constitutive InsP3 receptor Ca2+ transfer to mitochondria. Cell. 2010;142:270–283. - PMC - PubMed

Publication types

MeSH terms