An integrated ChIP-seq analysis platform with customizable workflows
- PMID: 21736739
- PMCID: PMC3145611
- DOI: 10.1186/1471-2105-12-277
An integrated ChIP-seq analysis platform with customizable workflows
Abstract
Background: Chromatin immunoprecipitation followed by next generation sequencing (ChIP-seq), enables unbiased and genome-wide mapping of protein-DNA interactions and epigenetic marks. The first step in ChIP-seq data analysis involves the identification of peaks (i.e., genomic locations with high density of mapped sequence reads). The next step consists of interpreting the biological meaning of the peaks through their association with known genes, pathways, regulatory elements, and integration with other experiments. Although several programs have been published for the analysis of ChIP-seq data, they often focus on the peak detection step and are usually not well suited for thorough, integrative analysis of the detected peaks.
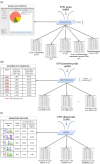
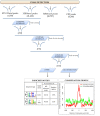
Results: To address the peak interpretation challenge, we have developed ChIPseeqer, an integrative, comprehensive, fast and user-friendly computational framework for in-depth analysis of ChIP-seq datasets. The novelty of our approach is the capability to combine several computational tools in order to create easily customized workflows that can be adapted to the user's needs and objectives. In this paper, we describe the main components of the ChIPseeqer framework, and also demonstrate the utility and diversity of the analyses offered, by analyzing a published ChIP-seq dataset.
Conclusions: ChIPseeqer facilitates ChIP-seq data analysis by offering a flexible and powerful set of computational tools that can be used in combination with one another. The framework is freely available as a user-friendly GUI application, but all programs are also executable from the command line, thus providing flexibility and automatability for advanced users.
Figures


Similar articles
-
ChiLin: a comprehensive ChIP-seq and DNase-seq quality control and analysis pipeline.BMC Bioinformatics. 2016 Oct 3;17(1):404. doi: 10.1186/s12859-016-1274-4. BMC Bioinformatics. 2016. PMID: 27716038 Free PMC article.
-
HiChIP: a high-throughput pipeline for integrative analysis of ChIP-Seq data.BMC Bioinformatics. 2014 Aug 15;15(1):280. doi: 10.1186/1471-2105-15-280. BMC Bioinformatics. 2014. PMID: 25128017 Free PMC article.
-
An Integrated Platform for Genome-wide Mapping of Chromatin States Using High-throughput ChIP-sequencing in Tumor Tissues.J Vis Exp. 2018 Apr 5;(134):56972. doi: 10.3791/56972. J Vis Exp. 2018. PMID: 29683440 Free PMC article.
-
Role of ChIP-seq in the discovery of transcription factor binding sites, differential gene regulation mechanism, epigenetic marks and beyond.Cell Cycle. 2014;13(18):2847-52. doi: 10.4161/15384101.2014.949201. Cell Cycle. 2014. PMID: 25486472 Free PMC article. Review.
-
ChIP-Seq: A Powerful Tool for Studying Protein-DNA Interactions in Plants.Curr Issues Mol Biol. 2018;27:171-180. doi: 10.21775/cimb.027.171. Epub 2017 Sep 8. Curr Issues Mol Biol. 2018. PMID: 28885181 Review.
Cited by
-
IFN-γ Induces Histone 3 Lysine 27 Trimethylation in a Small Subset of Promoters to Stably Silence Gene Expression in Human Macrophages.Cell Rep. 2016 Sep 20;16(12):3121-3129. doi: 10.1016/j.celrep.2016.08.051. Cell Rep. 2016. PMID: 27653678 Free PMC article.
-
ChiLin: a comprehensive ChIP-seq and DNase-seq quality control and analysis pipeline.BMC Bioinformatics. 2016 Oct 3;17(1):404. doi: 10.1186/s12859-016-1274-4. BMC Bioinformatics. 2016. PMID: 27716038 Free PMC article.
-
MEF2B Instructs Germinal Center Development and Acts as an Oncogene in B Cell Lymphomagenesis.Cancer Cell. 2018 Sep 10;34(3):453-465.e9. doi: 10.1016/j.ccell.2018.08.006. Cancer Cell. 2018. PMID: 30205047 Free PMC article.
-
AICDA drives epigenetic heterogeneity and accelerates germinal center-derived lymphomagenesis.Nat Commun. 2018 Jan 15;9(1):222. doi: 10.1038/s41467-017-02595-w. Nat Commun. 2018. PMID: 29335468 Free PMC article.
-
ORIO (Online Resource for Integrative Omics): a web-based platform for rapid integration of next generation sequencing data.Nucleic Acids Res. 2017 Jun 2;45(10):5678-5690. doi: 10.1093/nar/gkx270. Nucleic Acids Res. 2017. PMID: 28402545 Free PMC article.
References
Publication types
MeSH terms
Substances
Associated data
- Actions
LinkOut - more resources
Full Text Sources
Other Literature Sources
Miscellaneous

