. 2011 Aug 2;108(31):E365-73.
doi: 10.1073/pnas.1102255108. Epub 2011 Jul 5.

Single-molecule investigations of the stringent response machinery in living bacterial cells

Affiliations

Single-molecule investigations of the stringent response machinery in living bacterial cells

Brian P English et al. Proc Natl Acad Sci U S A. .

Abstract

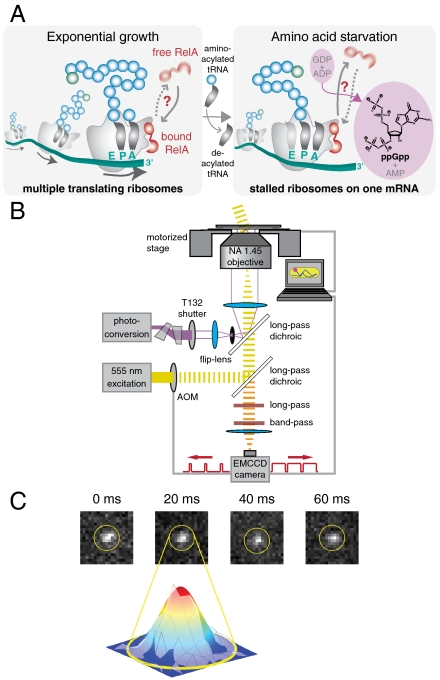
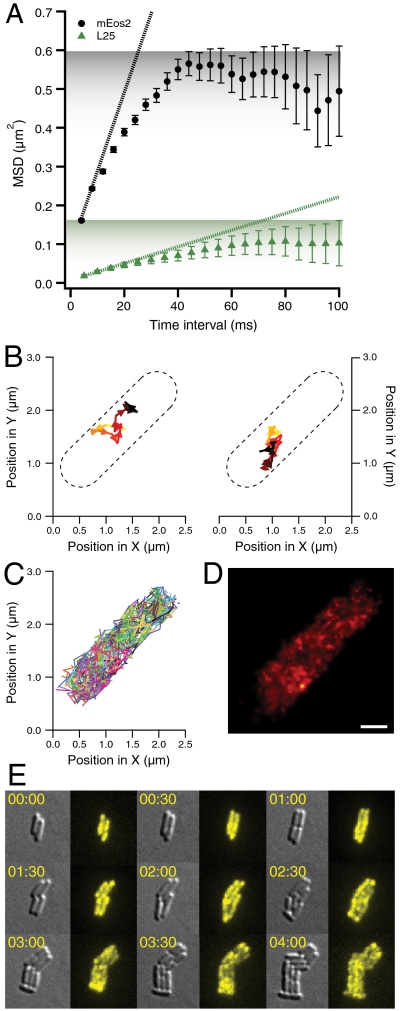
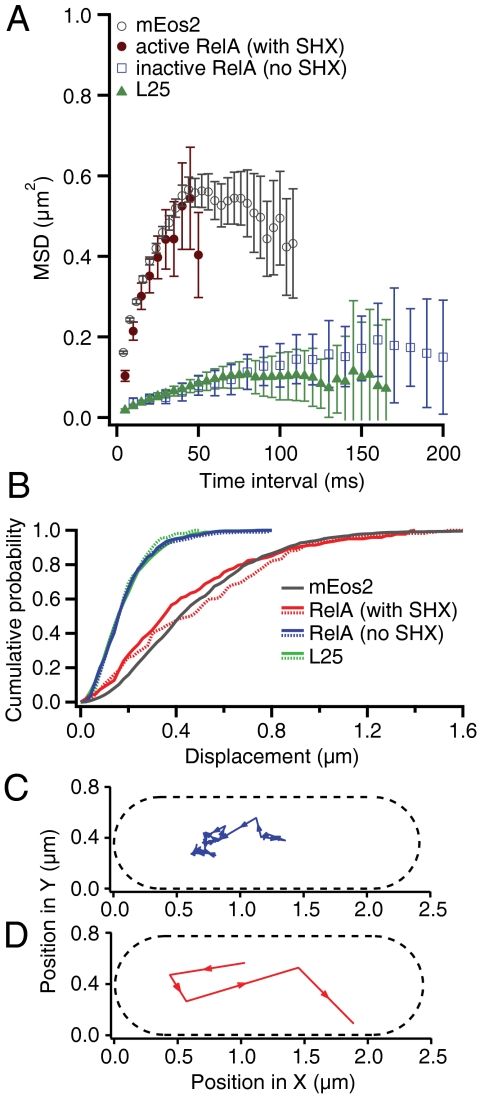
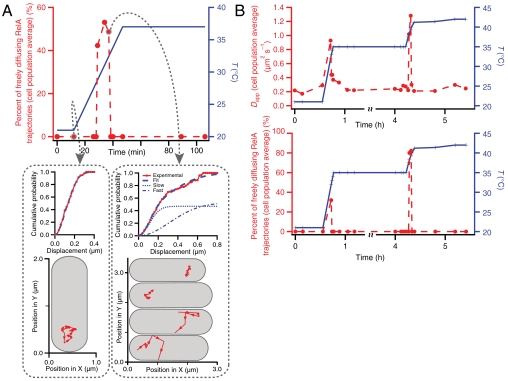
The RelA-mediated stringent response is at the heart of bacterial adaptation to starvation and stress, playing a major role in the bacterial cell cycle and virulence. RelA integrates several environmental cues and synthesizes the alarmone ppGpp, which globally reprograms transcription, translation, and replication. We have developed and implemented novel single-molecule tracking methodology to characterize the intracellular catalytic cycle of RelA. Our single-molecule experiments show that RelA is on the ribosome under nonstarved conditions and that the individual enzyme molecule stays off the ribosome for an extended period of time after activation. This suggests that the catalytically active part of the RelA cycle is performed off, rather than on, the ribosome, and that rebinding to the ribosome is not necessary to trigger each ppGpp synthesis event. Furthermore, we find fast activation of RelA in response to heat stress followed by RelA rapidly being reset to its inactive state, which makes the system sensitive to new environmental cues and hints at an underlying excitable response mechanism.


Conflict of interest statement

The authors declare no conflict of interest.

Figures

Fig. 1.
Fig. 1.
Single-molecule tracking in living cells. (A) Schematic drawing of RelA interacting with a polysome. During exponential cell growth, RelA could either be bound to the polysome (10) or diffuse rapidly in the cytosol (Left). During amino acid limitation the level of tRNA acylation drops, resulting in accumulation of deacylated tRNA in the ribosomal A site. Under these conditions RelA could either be in tight complex with a polysome (46) or unbind from the ribosome and undergo rapid cytosolic diffusion (Right). (B) Schematic diagram of the optical setup. An acousto-optical modulator is synchronized with an EMCCD camera and shutters a wide-field yellow excitation laser beam to pass short excitation pulses in the middle of each imaging frame. A violet photoconversion laser beam is spatially overlapped and can either be focused onto the back aperture of an Olympus TIRF objective or focused onto the sample plane via a flip-lens. (C) Four consecutive frames of a time-lapse movie of RelA–Dendra2 (in nonstarved cells) with a frame time of 20 ms and an exposure time of 5 ms and a Gaussian fit to frame 2.
Fig. 2.
Fig. 2.
Normal free diffusion in the cytosol of E. coli. (A) A single experimentally obtained single-molecule mEos2 trajectory with a frame time of 4 ms and an exposure time of 1 ms. (B) Overlay of 1,355 single-molecule mEos2 trajectories obtained in an individual E. coli cell with a frame time of 4 ms and an exposure time of 1 ms. (C) Local apparent diffusion coefficients in the sample (x-y) plane. The apparent diffusion coefficients are evaluated every 20 by 20 nm in an x-y grid. Each point in the figure is false-colored according to the apparent diffusion coefficient calculated from the mean square displacement over 4 ms for experimental (Upper) and simulated (Lower) displacements originating within 200 nm of this point. The simulations assume normal diffusion at D = 12.5 μm2 s-1 in the volume defined by the geometry of this cell. There is good agreement between apparent experimental diffusion coefficients and those obtained from simulations. The apparent diffusion coefficients are higher in the middle of the cell, as the molecules are less confined along the long axis. Noise contributions make the apparent diffusion faster close to the cell wall. (D) Mean square displacements (MSDs) in the sample (x-y) plane for different time intervals. Experimental MSDs and error bars representing experimental standard errors of the means are displayed in red. The confidence intervals (blue) are obtained from simulations in the volumes defined by the cell geometry by calculating and sorting MSDs for trajectories using a diffusion coefficient of 13 μm2 s-1. The average MSDs (black, dashed) are also obtained from simulations. Here we vary the diffusion coefficient for each cell to obtain the closest match to the experimental curve. (E) Overlay of 500 positions of single-molecule mEos2 trajectories in one E. coli cell with a frame time of 4 ms and an exposure time of 1 ms. Each position is represented by a Gaussian with a standard deviation equal to the localization error. The mean localization error is 44 nm and the scale bar represents 500 nm.
Fig. 3.
Fig. 3.
Single-molecule ribosome tracking and ensemble time-lapse imaging in individual living cells. (A) Mean square displacements (MSDs) in the sample (x-y) plane for mEos2 (in black, from 3,766 trajectories) and ribosome (in green, from 537 trajectories) tracking for different time intervals with error bars representing standard errors of the means. For ribosome tracking, we labeled the ribosomal protein L25 with the photoconvertible GFP variant Dendra2 (25) (see Materials and Methods). The dotted lines are calculated from the slope of the first two time points (corresponding to Dapp of 5.1 and 0.5 μm2 s-1, respectively). As estimated from the initial slopes of the MSD curves, mEos2 has a 10-fold higher apparent diffusion coefficient than Dendra2-labeled ribosomes. The shading represents the different plateaus for mEos2 and L25 MSDs. (B) Two experimentally obtained single-molecule ribosome trajectories with a frame time of 50 ms. The individual ribosome trajectories are recorded for 0.65 and 1.15 s, respectively. The ribosome is tagged via an N-terminally Dendra2 labeled L25 ribosomal protein. (C) Overlay of all 224 single-molecule ribosome trajectories in one E. coli cell with a frame time of 50 ms. (D) Overlay of 1,000 positions of single-molecule ribosome trajectories in one E. coli cell with a frame time of 50 ms. Each position is represented by a Gaussian with a standard deviation equal to the localization error. The mean localization error is 43 nm and the scale bar represents 500 nm. (E) Time-lapse image acquisitions (differential interference contrast and fluorescence imaging) of ribosome distributions in dividing E. coli cells. The fluorescence of Dendra2 from chromosomally labeled C-terminal ribosomal protein S2 is activated at time zero. Subsequent time-lapse imaging followed the initial distribution of the photoconverted ribosomes as they are passed between the cells upon repeated cell division. The cellular distribution of this photoconverted Dendra2 is recorded every five minutes. We present nine snapshots over a period of four hours. Experiments with ribosomal protein L19 and L31-labeled strains resulted in similar data.
Fig. 4.
Fig. 4.
Diffusion comparison of the ribosome to RelA in exponentially growing E. coli cells and to RelA during stringent response. (A) Mean square displacements (MSDs) in the sample plane of E. coli cells over different time intervals. The error bars represent the experimental standard errors of the means. MSDs from the ribosomal protein L25 are displayed in green (5-ms frame time, 537 single-molecule trajectories, 3,421 positions). When E. coli cells are growing exponentially the MSDs of RelA diffusion (in blue, 10-ms frame time, 90 trajectories, 527 positions) are indistinguishable from L25 diffusion. When cells are starved by addition of 2.5 mM of L-Serine Hydroxamate (brown MSD curve, 5-ms frame time, 216 trajectories, 977 positions), the diffusion of RelA changes dramatically, and is similar to that of mEos2 (average MSDs obtained from all 3,766 single-molecule mEos2 trajectories is displayed in gray). (B) Cumulative distribution functions (CDFs) of displacements over 20 ms in the sample plane of E. coli cells. Two CDFs for trajectories of RelA in its inactive unstarved state (in solid-blue with 20-ms frame time, 129 trajectories, 1,325 positions, and dashed-blue with 10-ms frame time, 90 trajectories, 527 positions) and that of L25 (in dashed-green with 20-ms frame time, 49 trajectories, 478 positions, and solid-green with 5-ms frame time, 537 trajectories, 3,421 positions) are indistinguishable. The apparent diffusion coefficient of RelA when cells are starved increases more than eightfold (red and dashed-red curves) and is very similar to the CDF of mEos2 (in gray, average CDF obtained from eight cells). (C) One experimentally obtained single-molecule RelA trajectory with a frame time of 20 ms and an exposure time of 2 ms when cells are exponentially dividing. (D) One experimentally obtained single-molecule RelA trajectory with a frame time of 20 ms and an exposure time of 2 ms when cells are starved using 2.5 mM L-SHX.
Fig. 5.
Fig. 5.
Diffusion characteristics of RelA during temperature upshift. (A) Individual RelA trajectories are recorded with a frame time of 10 ms and a laser exposure time of 2 ms. The temperature is adjusted from a constant 21 to 37 °C during the measurement. When the temperature is held constant at 21 °C, only slowly diffusing RelA trajectories are observed (see lower left panel for one representative trajectory recorded just before the start of the temperature shift). This diffusion is indistinguishable from ribosome diffusion (see Fig. 4B, green curves). During the temperature jump one transiently observes fast diffusion trajectories [see lower right panel, where two representative cells have inactive RelA (upper most cells), and the two lower cells display rapid RelA diffusion]. Very briefly roughly half of the cells display rapid RelA diffusion reminiscent of RelA diffusion during stringent response (see Fig. 4B, red curves). After the temperature has reached a constant 37 °C once again only slowly diffusing RelA trajectories are observed. Each point is an average over 20 trajectories. (B) Individual RelA trajectories are recorded with a frame time of 20 ms and a laser exposure time of 2 ms. The temperature is adjusted twice during the measurement, first from a constant 21 to 35 °C and again from 35 to 42 °C. The top panel displays apparent diffusion coefficients obtained by fitting P(rt) = 1 - exp(-r2/4DappΔt) to the experimental CDFs of all the displacements in the sample plane. An apparent diffusion coefficient of 0.2 μm2 s-1 is obtained when the temperature is held constant either at 21, 35, or 42 °C. Again, rapidly diffusing RelA trajectories are observed transiently when the temperature is adjusted both from 21 to 35 °C and again from 35 to 42 °C (see lower panel). Each point is an average over 10 trajectories.
Fig. P1.
Fig. P1.
Diffusion comparisons. Mean square displacements (MSDs) for mEos2 (in black), ribosomal protein L25 (in green), active RelA (in brown, with 2.5 mM of L-Serine Hydroxamate), and for inactive RelA diffusion (in blue, in exponentially growing cells) with error bars representing standard errors of the means. Inactive RelA diffusion is indistinguishable from the diffusion of Dendra2-labeled ribosomes. When cells are starved, the diffusion of RelA changes dramatically and is similar to that of mEos2. (Inset) When the temperature is held constant, only slowly diffusing RelA trajectories are observed (left trajectory, recorded with a frame time of 10 ms). During the temperature jump from 21 °C to 37 °C, one transiently observes fast diffusion trajectories of RelA (right trajectory, with a frame time of 10 ms).

Similar articles

Cited by

References

    1. Potrykus K, Cashel M. (p)ppGpp: Still magical? Annu Rev Microbiol. 2008;62:35–51. - PubMed
    1. Haseltine WA, Block R. Synthesis of guanosine tetra- and pentaphosphate requires the presence of a codon-specific, uncharged transfer ribonucleic acid in the acceptor site of ribosomes. Proc Natl Acad Sci USA. 1973;70:1564–1568. - PMC - PubMed
    1. Vrentas CE, et al. Still looking for the magic spot: The crystallographically defined binding site for ppGpp on RNA polymerase is unlikely to be responsible for rRNA transcription regulation. J Mol Biol. 2008;377:551–564. - PMC - PubMed
    1. Wang JD, Sanders GM, Grossman AD. Nutritional control of elongation of DNA replication by (p)ppGpp. Cell. 2007;128:865–875. - PMC - PubMed
    1. Milon P, et al. The nucleotide-binding site of bacterial translation initiation factor 2 (IF2) as a metabolic sensor. Proc Natl Acad Sci U S A. 2006;103:13962–13967. - PMC - PubMed

Publication types

MeSH terms

LinkOut - more resources