. 2011 Jul 3;12(8):778-85.
doi: 10.1038/ni.2063.

The transcription factor NR4A1 (Nur77) controls bone marrow differentiation and the survival of Ly6C- monocytes

Affiliations

The transcription factor NR4A1 (Nur77) controls bone marrow differentiation and the survival of Ly6C- monocytes

Richard N Hanna et al. Nat Immunol. .

Abstract

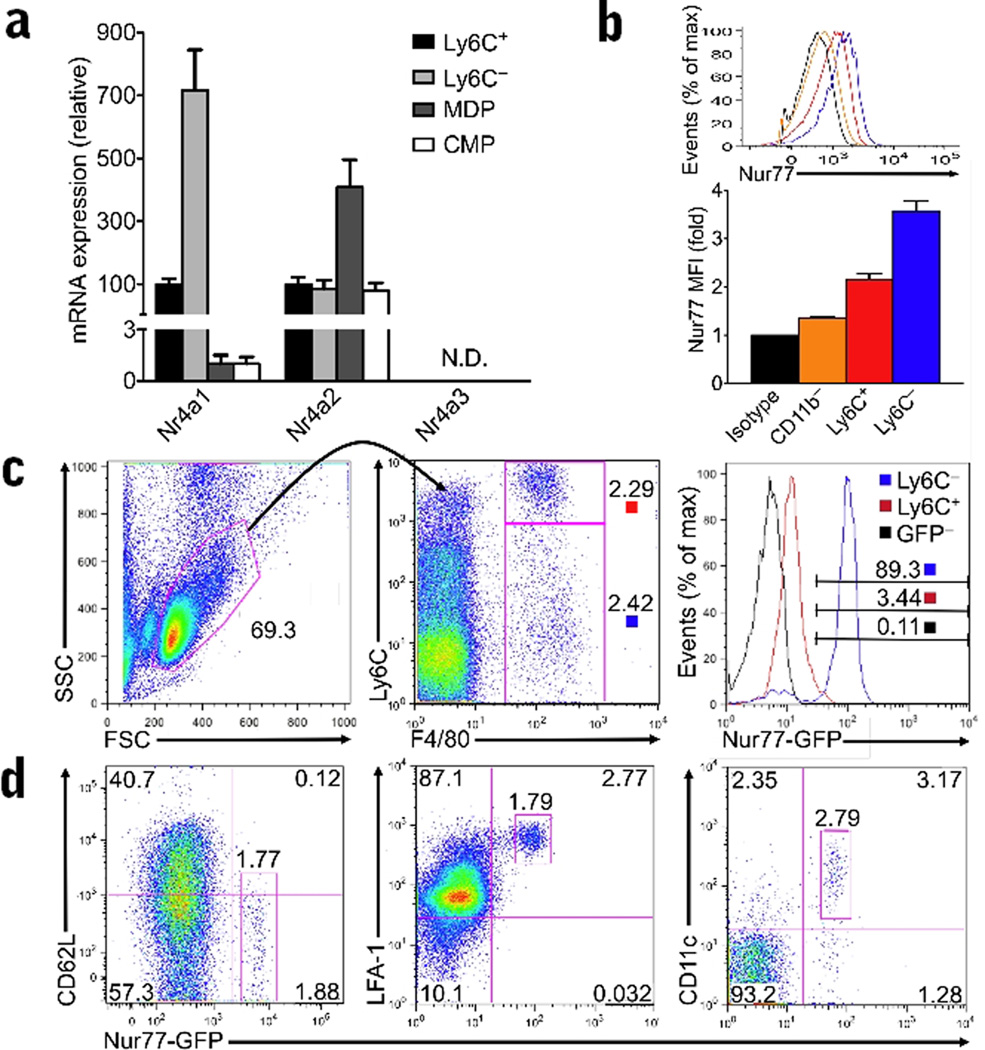
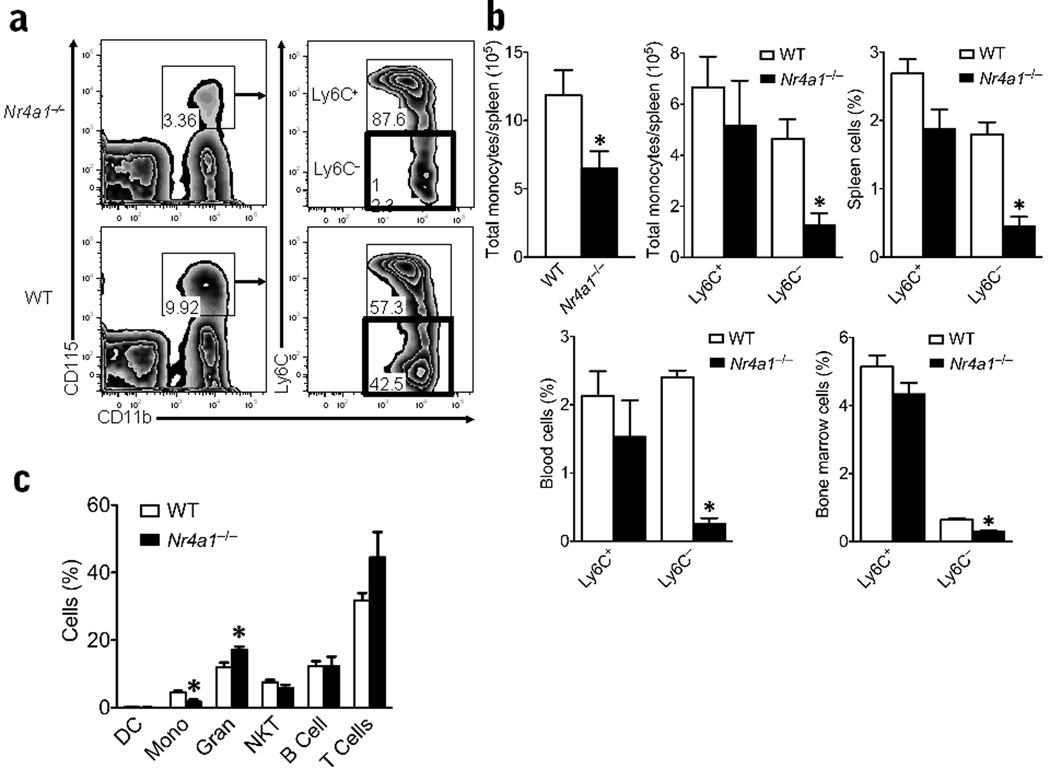
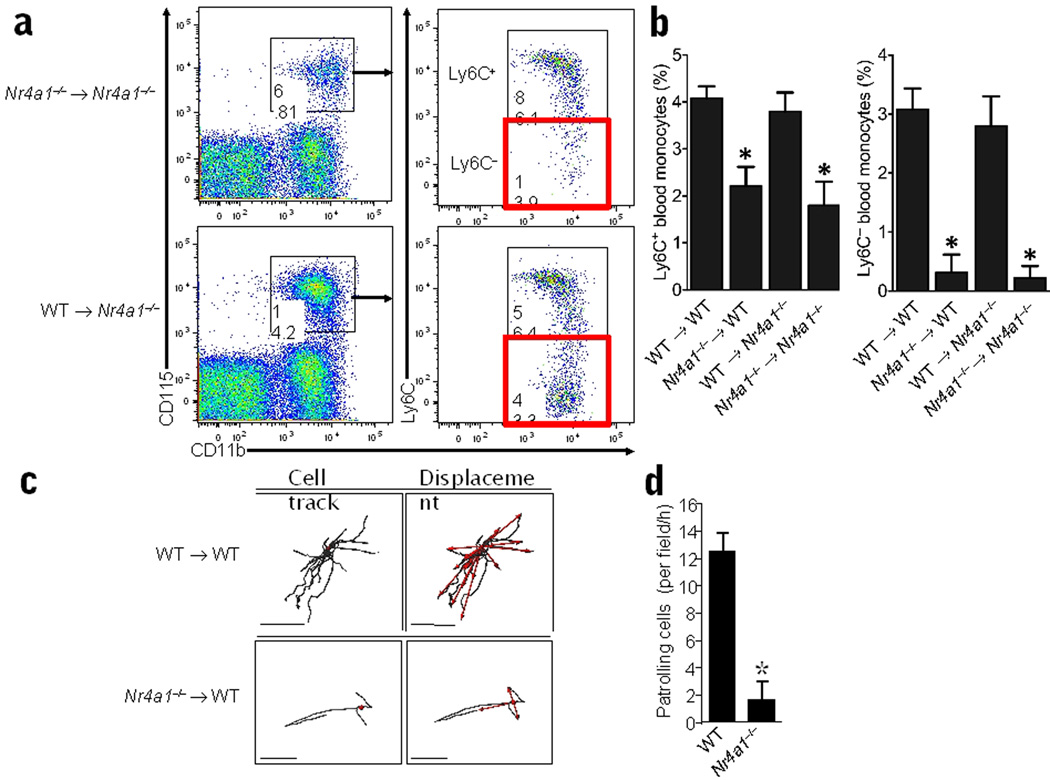
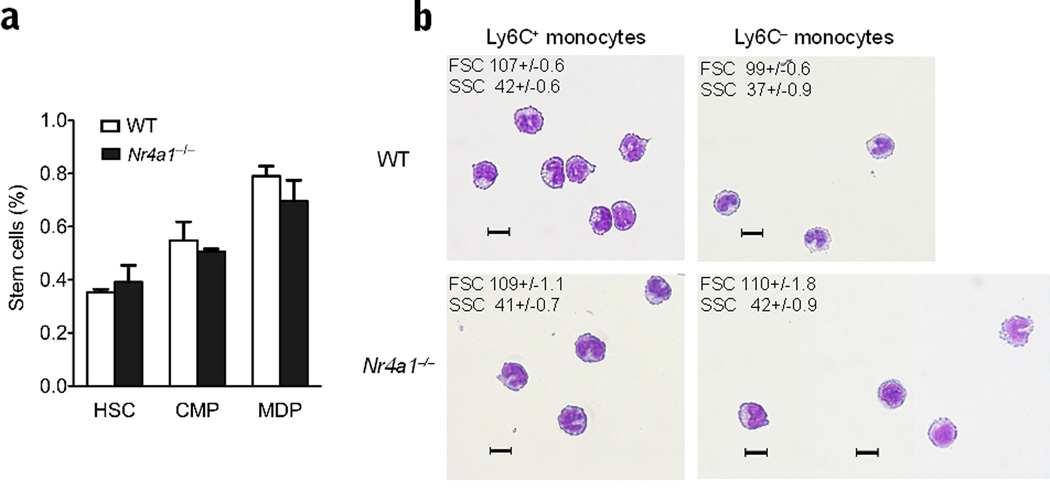
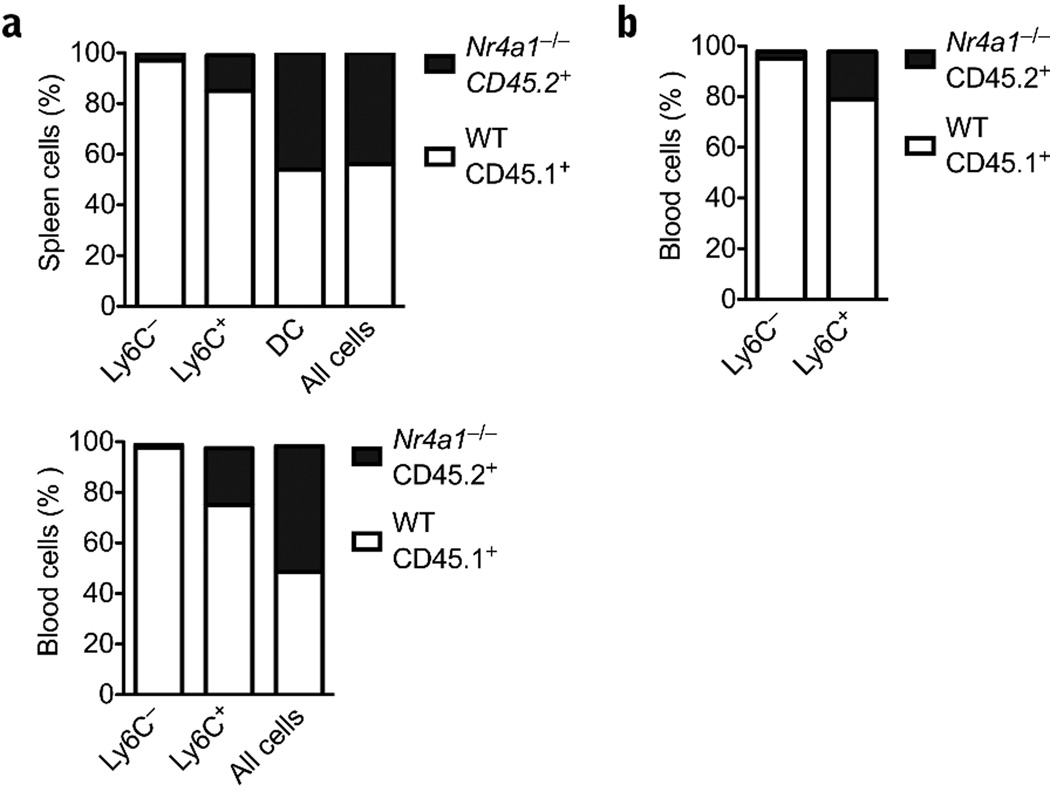
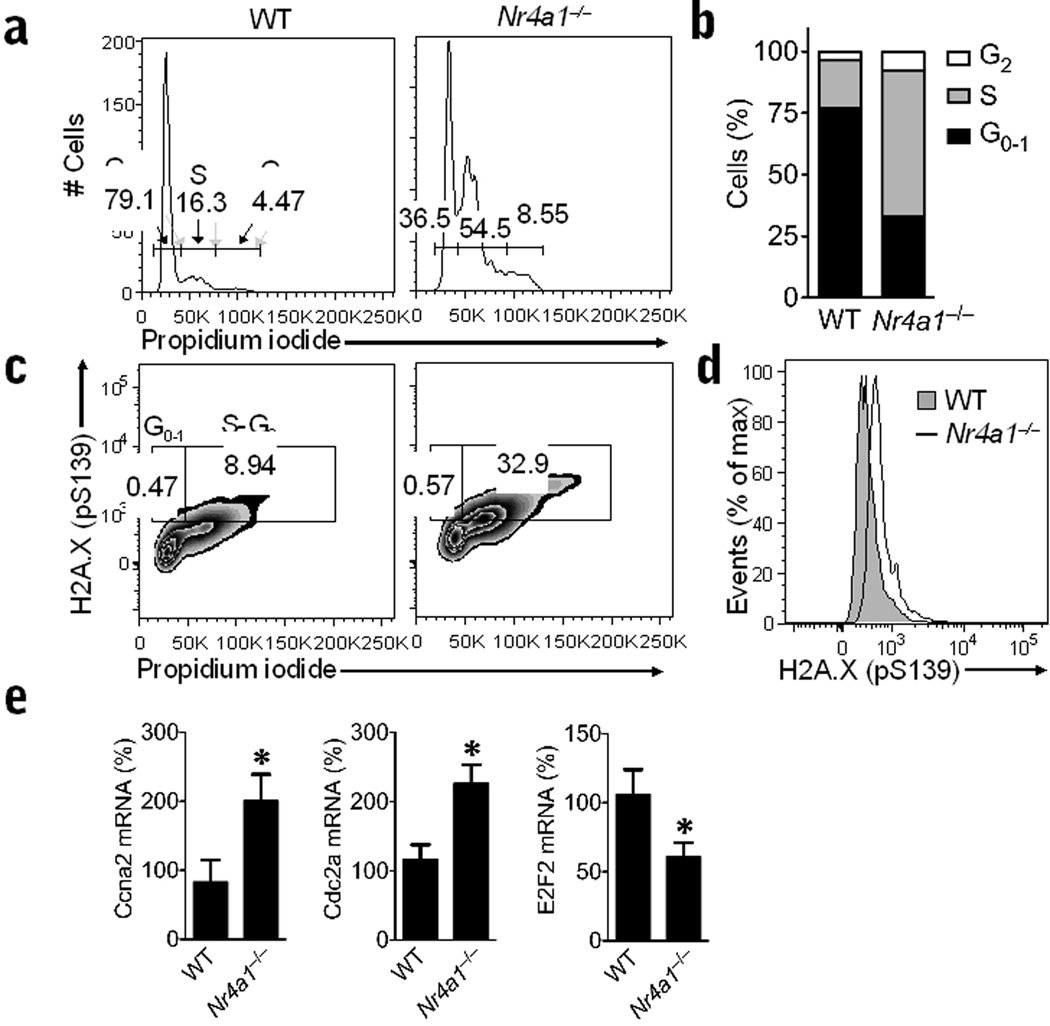
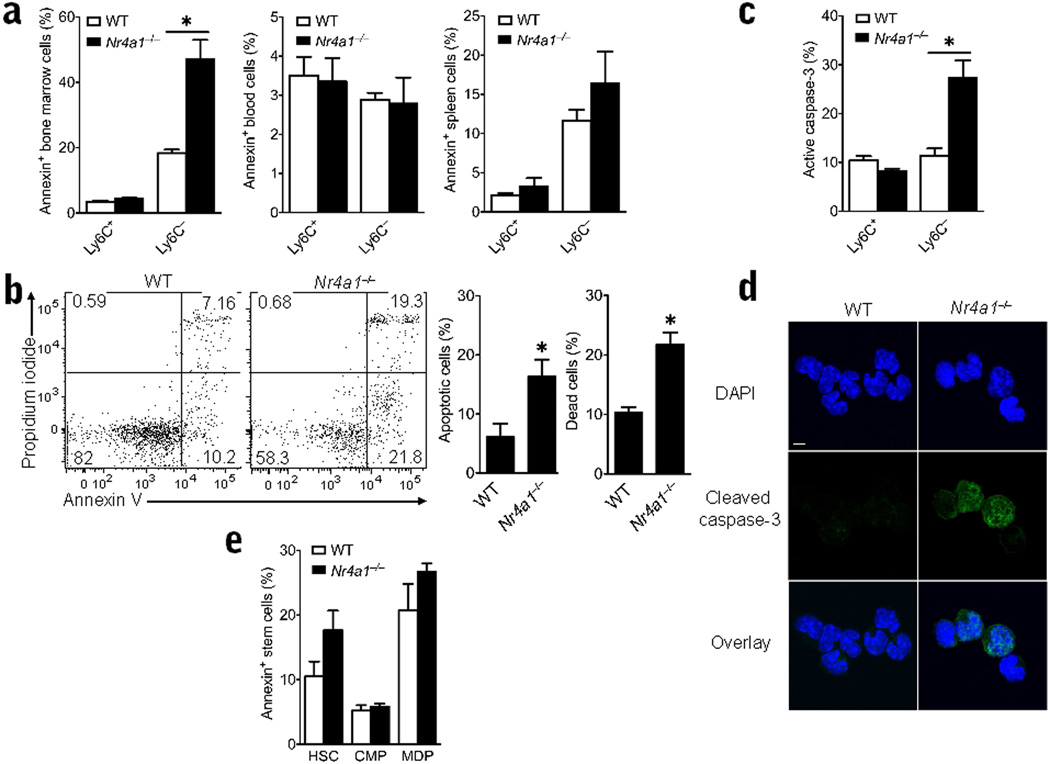
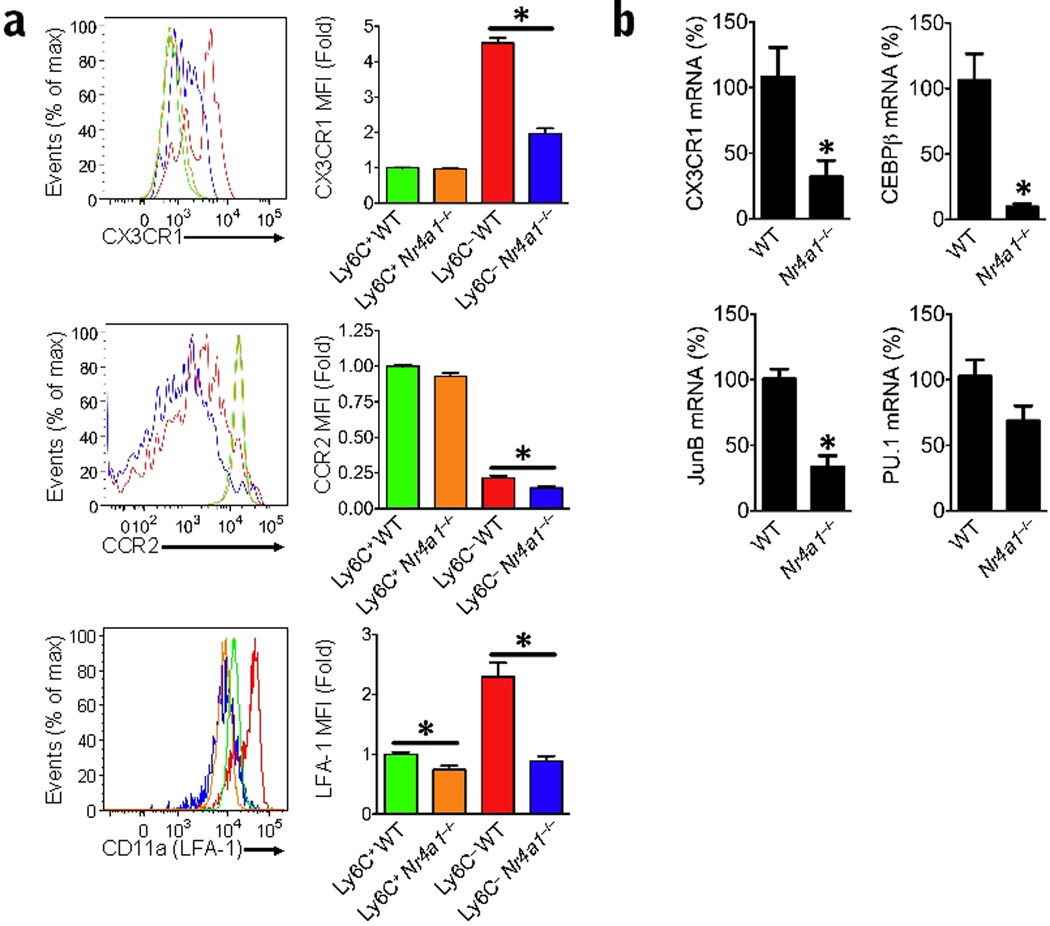
The transcription factors that regulate differentiation into the monocyte subset in bone marrow have not yet been identified. Here we found that the orphan nuclear receptor NR4A1 controlled the differentiation of Ly6C- monocytes. Ly6C- monocytes, which function in a surveillance role in circulation, were absent from Nr4a1-/- mice. Normal numbers of myeloid progenitor cells were present in Nr4a1-/- mice, which indicated that the defect occurred during later stages of monocyte development. The defect was cell intrinsic, as wild-type mice that received bone marrow from Nr4a1-/- mice developed fewer patrolling monocytes than did recipients of wild-type bone marrow. The Ly6C- monocytes remaining in the bone marrow of Nr4a1-/- mice were arrested in S phase of the cell cycle and underwent apoptosis. Thus, NR4A1 functions as a master regulator of the differentiation and survival of 'patrolling' Ly6C- monocytes.


Figures

Figure 1
Figure 1. Nur77 is expressed in Ly6C monocytes
(a) Relative mRNA expression of NR4A1 family members Nr4a1, Nr4a2, and Nr4a3 in wild-type bone marrow of FACS sorted Ly6C+, Ly6C, MDP and CMP populations analyzed by qRT-PCR (n = 6 mice; expressed as a percentage of Ly6C+ monocyte transcript). (b) Nur77 protein expression in Ly6C+ and Ly6C monocyte populations from wild-type bone marrow, and CD11b non-myeloid cells measured by flow cytometric intracellular staining with a Nur77-specific antibody. For A and B, isolated monocyte populations were determined to be over 95% pure by Cytospin preps of sorted cells stained with HEMA3 dye. (c) Live F4/80+ CD11b+ monocytes from the peripheral blood of a Nur77-GFP transgenic reporter mouse and Nur77-GFP negative (GFP-) littermate control were assessed for Ly6C and GFP expression by flow cytometry. Left and center, representative gating strategy to identify Ly6C+ and Ly6C monocytes in the blood. Right, representative histogram of Ly6C+ and Ly6C monocytes, and cells from Nur77-GFP negative (GFP) littermate control in the blood with a gate defining Nur77-GFPhigh expression. (d) Circulating GFPhi cells in Nur77-GFP reporter mice express other features of patrolling monocytes. Flow cytometry was performed on Nur77-GFP and control peripheral blood cells stained with antibodies indicated. Data from Nur77-GFP mice are representative of 4 experiments.
Figure 2
Figure 2. Absence of Ly6C monocytes in Nr4a1−/− mice
(a) Live cells with low side scatter and Lin (CD3ε, CD19, CD49b, Ly6G) were plotted for CD115+ and CD11b+ expression and then gated for Ly6C+ and - expression. Representative flow cytometric scatter plot of CD11b+CD115+ monocyte populations further gated on Ly6C + or - expression in spleens of Nr4a1−/− mice or wild-type (WT) control mice (percentage of total population displayed on plot; red box highlights Ly6C monocyte population). (b) Quantification of the number of total monocytes/spleen (left panel), the number of Ly6C + and – monocytes/spleen (center panel), and the percent of Ly6C + and – monocytes/spleen of all live cells (right panel) analyzed by flow cytometry (*P < 0.001, n = 10 mice/group). Quantification of Ly6C + and – monocyte populations in blood and bone marrow of global Nr4a1−/− mice and wild-type control mice analyzed by flow cytometry (bottom panel). (*P < 0.001, n = 10 mice/group) (c) Quantification of other major hematopoietic cell populations found in the blood of global Nr4a1−/− mice and wild-type control mice analyzed by flow cytometry (*P <0.01, n = 10 mice/group). Results are expressed as % of live cells unless otherwise noted.
Figure 3
Figure 3. Cell-intrinsic defect in monocyte development and lack of patrolling ability in monocytes derived from Nr4a1−/− bone marrow
(a) Representative analysis of Ly6C+ and Ly6C monocyte populations in the blood of recipients of Nr4a1−/− or wild-type (WT) control transplanted whole bone marrow. (b) Quantification of monocyte populations in blood from whole bone marrow transplants of either wild-type (WT) or Nr4a1−/− donor bone marrow into lethally irradiated wild-type or Nr4a1−/− recipient mice. For whole bone marrow transplants, mice were irradiated with 2 doses of 600 RAD, reconstituted with a total of 5×10⁶ bone marrow cells from donors, and allowed to reconstitute 6 weeks before analysis (*P <0.001, n = 7 mice per group; results expressed as percentage of live cells). (c) CD45.1 recipient mice were irradiated with 9.5 Gy and reconstituted with bone marrow from either CD45.2 wild-type or CD45.2 Nr4a1−/− donors. After 6 weeks the mice were imaged and representative CD11b+ tracking data for wild-type recipients (upper 2 panels), and Nr4a1−/− BM recipients (lower 2 panels) are shown. Anesthetized mice were injected i.v. with 10 µg PE conjugated anti-mouse CD11b (clone M1/70) and cell tracks (left) and displacement vectors of individual cells (red arrows, right) were plotted. (d) Mean number (±SD) of patrolling CD11b+ cells/field/h in wild-type and Nr4a1−/− bone marrow recipients. Scale bars represent 60 um. * P <0.01 Mean ±SD, patrolling cells per field/h wild-type (3 fields/h and 2 animals) vs. Nr4a1−/− BM recipients (7 fields/h and 4 animals).
Figure 4
Figure 4. Normal stem cell populations and abnormal Ly6C monocytes in Nr4a1−/− mice
(a) Quantification of hematopoietic stem cells (HSC), common myeloid precursors (CMP) and macrophage dendritic precursor (MDP) cell population in the bone marrow of Nr4a1−/− mice and wild-type (WT) control mice analyzed by flow cytometry, (n = 10 mice per group) (b) CD115+ CD11b+ Ly6C + and – monocytes were isolated from Nr4a1−/− and wild-type bone marrow by cell sorting. Forward and side scatter (FSC and SSC) values are displayed in the upper left corner as mean+/−SE. (scale bar=10µm). Cells were stained with HEMA3.
Figure 5
Figure 5. Specific defect in differentiation of Ly6C monocytes from myeloid dendritic precursors (MDP) in the bone marrow
(a) Mixed chimera transplants of whole bone marrow 1:1 mixed donors (Nr4a1−/− CD45.2: wild-type CD45.1) into wild-type CD45.1 recipients (b) MDP cells were isolated by cell sorting from Nr4a1−/− or wild-type control bone marrow and mixed 1:1 (Nr4a1−/− CD45.2: wild-type CD45.1), and then reconstituted for seven days into lethally irradiated mice before analysis. For the whole bone marrow mixed chimera, 2.5×10⁶ cells from each donor were reconstituted into each recipient (P < 0.005, n = 4; results expressed as percent of cell population). For the MDP transfer, approximately 1×10⁴ cells from each donor were transferred into mice. (P < 0.005, n = 6 mice per group; results expressed as percent of cell population).
Figure 6
Figure 6. Abnormal cell cycle and DNA damage in Ly6C monocytes from Nr4a1−/− mice
(a) Representative flow cytometry analysis of cell cycle progression in bone marrow Ly6C monocytes from wild-type (WT) control or Nr4a1−/− mice stained with propidium iodide. Gates show percentage of cells in G1-0 phase (left), S phase (middle), and G2 phase (right) of the cell cycle. (b) Quantification of data in panel A expressed as an average percentage of cells in each phase of cell cycle (*P < 0.009, n = 6 mice/group). (c) Representative flow analysis of DNA damage during cell cycle progression in bone marrow Ly6C monocytes from wild-type control or Nr4a1−/− mice as measured by H2A.X phospho-serine139 and propidium iodide staining. Gates show percentage of cells in G1-0 phase (left) and S-G2 phase (right) of the cell cycle. (d) Representative histogram showing H2A.X phospho-serine139 measurement of DNA damage in bone marrow Ly6C monocytes from wild-type control or Nr4a1−/− mice. (e) Relative expression of Cyclin A2 (Ccna2), Cdk1 (Cdc2a), and E2F2 (E2f2) transcripts in Ly6C monocytes isolated by FACS from bone marrow of Nr4a1−/− or wild-type mice and measured by qRT-PCR. (*P < 0.05, n = 6 mice/group, expressed as a percentage of wild-type transcript).
Figure 7
Figure 7. Increased apoptosis exclusively in Ly6C bone marrow monocytes from Nr4a1−/− mice
(a) Apoptosis detection in Ly6C + and – monocytes in bone marrow, spleen and blood in Nr4a1−/− or wild-type (WT) control mice as measured by flow cytometric analysis of Annexin V staining. * P <0.01, n = 6 mice/group). (b) Left panel shows representative scatterplot of Annexin V staining to detect apoptosis and propidium iodide staining to detect cell death in bone marrow Ly6C monocytes from Nur77−/− or wild-type control mice. Right panel shows quantification of apoptotic and dead cells measured by Annexin V and propidium iodide staining. (*P <0.01, n = 6) (c) Percent cells expressing cleaved (active) caspase-3 in bone marrow monocytes from Nr4a1−/− or wild-type mice using flow cytometry. (*P <0.009 n=8 mice/group) (d) Representative cleaved (active) caspase-3 and DAPI (nuclear) immunofluorescence microscopy of Ly6C bone marrow monocytes isolated by FACS from Nr4a1−/− or wild-type mice. (scale bar=5µm) (e) Apoptosis detection in myeloid stem cell populations of bone marrow in Nr4a1−/− or wild-type control mice as measured by flow cytometric analysis of Annexin V staining. (n = 6 mice/group).
Figure 8
Figure 8. Decreased expression of chemokine receptors, adhesion molecules and differentiation factors in Ly6C monocytes from Nr4a1−/− mice
(a) Expression of CCR2, CX3CR1, and LFA-1 (CD11a) in monocyte populations from Nr4a1−/− or wild-type (WT) control bone marrow analyzed by flow cytometry. (*P <0.05 n = 5 mice/group; bar graphs show MFI fold change compared to Ly6C+ WT cells) (b) Relative expression of Cx3cr1, Cebpb, Junb and Sfpi1 (PU.1) transcripts in Ly6C monocytes isolated by FACS from bone marrow of Nr4a1−/− or wild-type mice measured by qRT-PCR. (*P <0.05 n = 6 mice per group, expressed as a percentage of wild-type transcript).

Comment in

Similar articles

Cited by

References

    1. Martínez-González J, Badimon L. The NR4A subfamily of nuclear receptors: new early genes regulated by growth factors in vascular cells. Cardiovasc Res. 2005;65:609–618. - PubMed
    1. Lim RW, Varnum BC, Herschman HR. Cloning of tetradecanoyl phorbol ester-induced 'primary response' sequences and their expression in density-arrested Swiss 3T3 cells and a TPA non-proliferative variant. Oncogene. 1987;1:263–270. - PubMed
    1. Hazel TG, Nathans D, Lau LF. A gene inducible by serum growth factors encodes a member of the steroid and thyroid hormone receptor superfamily. Proc Natl Acad Sci U S A. 1988;85:8444–8448. - PMC - PubMed
    1. Moll UM, Marchenko N, Zhang XK. p53 and Nur77/TR3 - transcription factors that directly target mitochondria for cell death induction. Oncogene. 2006;25:4725–4743. - PubMed
    1. Li QX, Ke N, Sundaram R, Wong-Staal F. NR4A1, 2, 3--an orphan nuclear hormone receptor family involved in cell apoptosis and carcinogenesis. Histol Histopathol. 2006;21:533–540. - PubMed

Publication types

MeSH terms

LinkOut - more resources