

Blockade of gap junction hemichannel suppresses disease progression in mouse models of amyotrophic lateral sclerosis and Alzheimer's disease
- PMID: 21712989
- PMCID: PMC3119678
- DOI: 10.1371/journal.pone.0021108
Blockade of gap junction hemichannel suppresses disease progression in mouse models of amyotrophic lateral sclerosis and Alzheimer's disease
Abstract
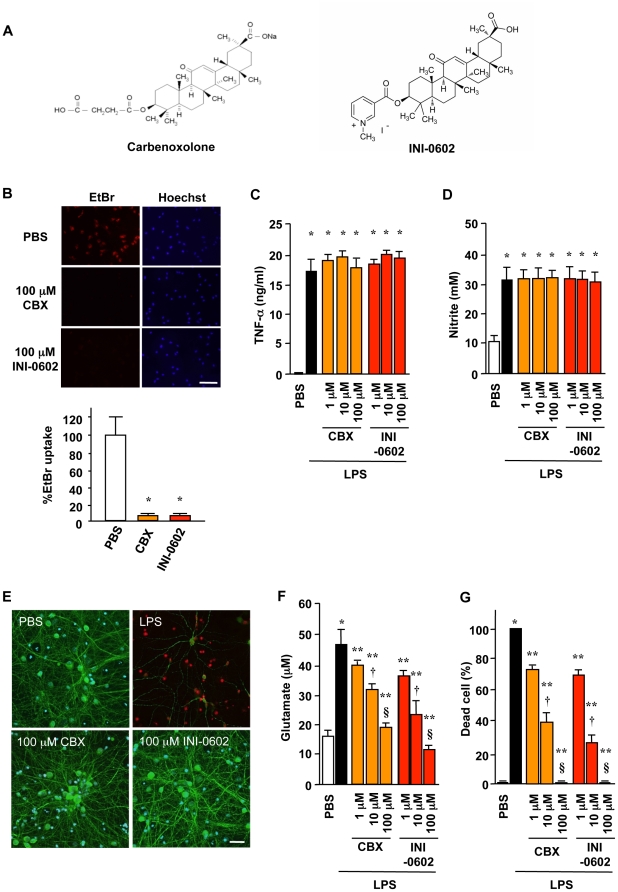
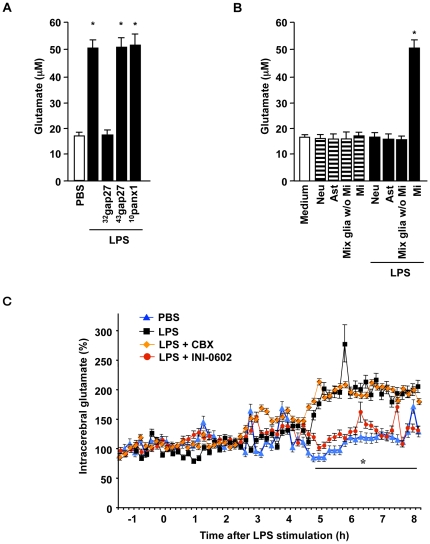
Background: Glutamate released by activated microglia induces excitotoxic neuronal death, which likely contributes to non-cell autonomous neuronal death in neurodegenerative diseases, including amyotrophic lateral sclerosis and Alzheimer's disease. Although both blockade of glutamate receptors and inhibition of microglial activation are the therapeutic candidates for these neurodegenerative diseases, glutamate receptor blockers also perturbed physiological and essential glutamate signals, and inhibitors of microglial activation suppressed both neurotoxic/neuroprotective roles of microglia and hardly affected disease progression. We previously demonstrated that activated microglia release a large amount of glutamate specifically through gap junction hemichannel. Hence, blockade of gap junction hemichannel may be potentially beneficial in treatment of neurodegenerative diseases.
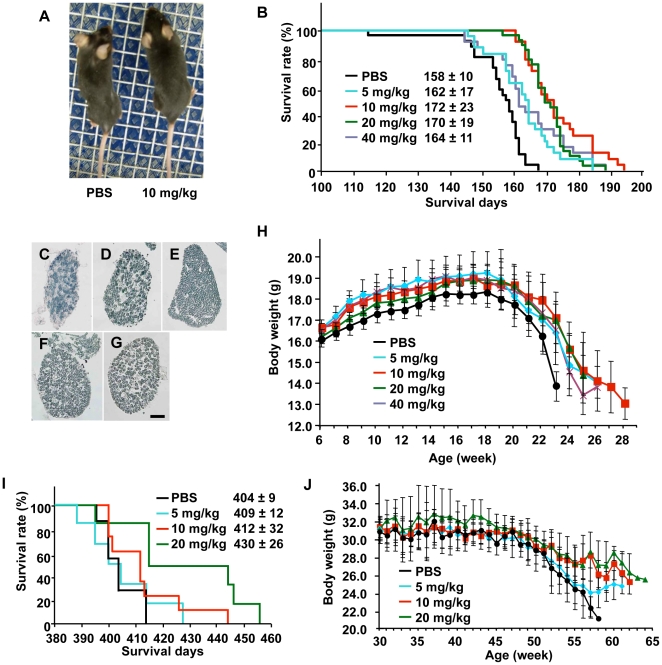
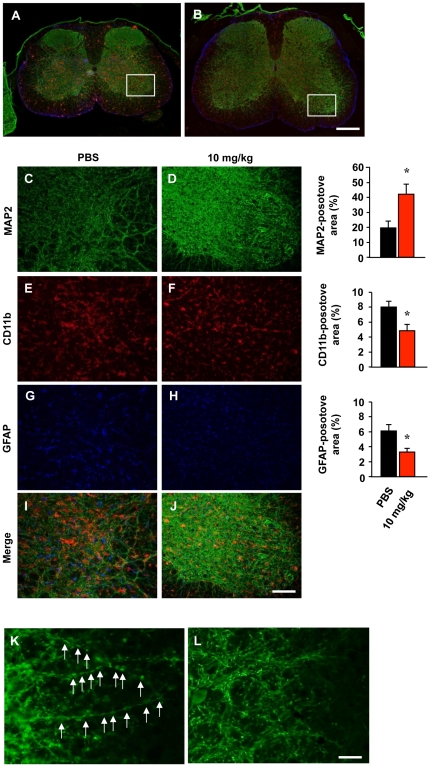
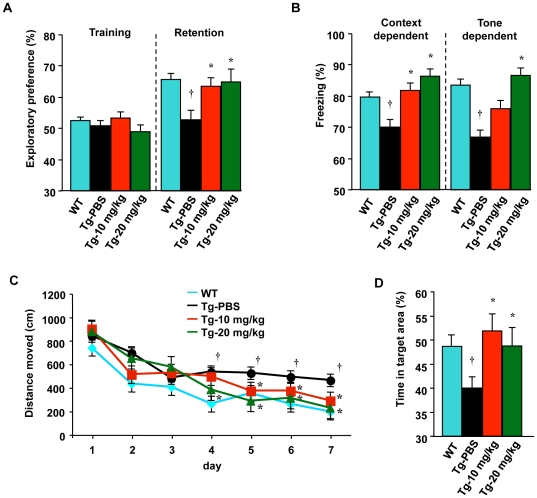
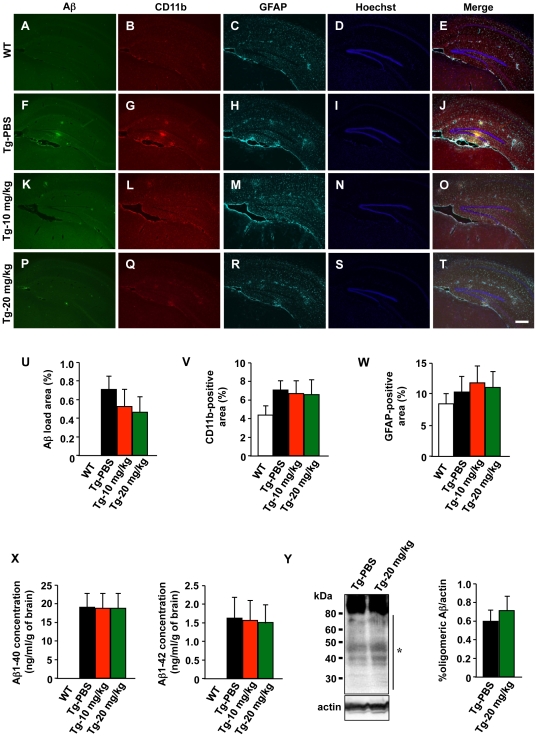
Methods and findings: In this study, we generated a novel blood-brain barrier permeable gap junction hemichannel blocker based on glycyrrhetinic acid. We found that pharmacologic blockade of gap junction hemichannel inhibited excessive glutamate release from activated microglia in vitro and in vivo without producing notable toxicity. Blocking gap junction hemichannel significantly suppressed neuronal loss of the spinal cord and extended survival in transgenic mice carrying human superoxide dismutase 1 with G93A or G37R mutation as an amyotrophic lateral sclerosis mouse model. Moreover, blockade of gap junction hemichannel also significantly improved memory impairments without altering amyloid β deposition in double transgenic mice expressing human amyloid precursor protein with K595N and M596L mutations and presenilin 1 with A264E mutation as an Alzheimer's disease mouse model.
Conclusions: Our results suggest that gap junction hemichannel blockers may represent a new therapeutic strategy to target neurotoxic microglia specifically and prevent microglia-mediated neuronal death in various neurodegenerative diseases.
Conflict of interest statement
Figures
Similar articles
-
Blockade of gap junction hemichannel protects secondary spinal cord injury from activated microglia-mediated glutamate exitoneurotoxicity.J Neurotrauma. 2014 Dec 15;31(24):1967-74. doi: 10.1089/neu.2013.3223. Epub 2014 Sep 23. J Neurotrauma. 2014. PMID: 24588281 Free PMC article.
-
System xC- is a mediator of microglial function and its deletion slows symptoms in amyotrophic lateral sclerosis mice.Brain. 2015 Jan;138(Pt 1):53-68. doi: 10.1093/brain/awu312. Epub 2014 Nov 10. Brain. 2015. PMID: 25384799 Free PMC article.
-
Knocking down metabotropic glutamate receptor 1 improves survival and disease progression in the SOD1(G93A) mouse model of amyotrophic lateral sclerosis.Neurobiol Dis. 2014 Apr;64:48-59. doi: 10.1016/j.nbd.2013.11.006. Epub 2013 Dec 19. Neurobiol Dis. 2014. PMID: 24361555
-
Gap junctions and hemichannels composed of connexins: potential therapeutic targets for neurodegenerative diseases.Front Cell Neurosci. 2014 Sep 2;8:189. doi: 10.3389/fncel.2014.00189. eCollection 2014. Front Cell Neurosci. 2014. PMID: 25228858 Free PMC article. Review.
-
Ion channels on microglia: therapeutic targets for neuroprotection.CNS Neurol Disord Drug Targets. 2011 Feb;10(1):44-56. doi: 10.2174/187152711794488638. CNS Neurol Disord Drug Targets. 2011. PMID: 21143139 Review.
Cited by
-
Ablation of keratan sulfate accelerates early phase pathogenesis of ALS.PLoS One. 2013 Jun 25;8(6):e66969. doi: 10.1371/journal.pone.0066969. Print 2013. PLoS One. 2013. PMID: 23825599 Free PMC article.
-
Inhibition of Gap Junctions Sensitizes Primary Glioblastoma Cells for Temozolomide.Cancers (Basel). 2019 Jun 20;11(6):858. doi: 10.3390/cancers11060858. Cancers (Basel). 2019. PMID: 31226836 Free PMC article.
-
The connexin43 mimetic peptide Gap19 inhibits hemichannels without altering gap junctional communication in astrocytes.Front Cell Neurosci. 2014 Oct 21;8:306. doi: 10.3389/fncel.2014.00306. eCollection 2014. Front Cell Neurosci. 2014. PMID: 25374505 Free PMC article.
-
Aberrant CHCHD2-associated mitochondriopathy in Kii ALS/PDC astrocytes.Acta Neuropathol. 2024 May 15;147(1):84. doi: 10.1007/s00401-024-02734-w. Acta Neuropathol. 2024. PMID: 38750212
-
Connexin Channels at the Glio-Vascular Interface: Gatekeepers of the Brain.Neurochem Res. 2017 Sep;42(9):2519-2536. doi: 10.1007/s11064-017-2313-x. Epub 2017 Jun 20. Neurochem Res. 2017. PMID: 28634726 Review.
References
-
- Block ML, Zecca L, Hong JS. Microglia-mediated neurotoxicity: uncovering the molecular mechanisms. Nat Rev Neurosci. 2007;8:57–69. - PubMed
-
- Kempermann G, Neumann H. Neuroscience. Microglia: the enemy within? Science. 2003;302:1689–1690. - PubMed
-
- Bruijn LI, Miller TM, Cleveland DW. Unraveling the mechanisms involved in motor neuron degeneration in ALS. Annu Rev Neurosci. 2004;27:723–749. - PubMed
-
- McGeer PL, McGeer EG. Inflammatory processes in amyotrophic lateral sclerosis. Muscle Nerve. 2002;26:459–470. - PubMed
-
- Takeuchi H, Jin S, Wang J, Zhang G, Kawanokuchi J, et al. Tumor necrosis factor-alpha induces neurotoxicity via glutamate release from hemichannels of activated microglia in an autocrine manner. J Biol Chem. 2006;281:21362–21368. - PubMed
Publication types
MeSH terms
Substances
LinkOut - more resources
Full Text Sources
Other Literature Sources
Medical
Molecular Biology Databases
Miscellaneous
