. 2011 Aug 26;286(34):29904-12.
doi: 10.1074/jbc.M111.258897. Epub 2011 Jun 28.

Effect of Src kinase phosphorylation on disordered C-terminal domain of N-methyl-D-aspartic acid (NMDA) receptor subunit GluN2B protein

Affiliations

Effect of Src kinase phosphorylation on disordered C-terminal domain of N-methyl-D-aspartic acid (NMDA) receptor subunit GluN2B protein

Ucheor B Choi et al. J Biol Chem. .

Abstract

NMDA receptors are ligand-gated ion channels with a regulatory intracellular C-terminal domain (CTD). In GluN2B, the CTD is the largest domain in the protein but is intrinsically disordered. The GluN2B subunit is the major tyrosine-phosphorylated protein in synapses. Src kinase phosphorylates the GluN2B CTD, but it is unknown how this affects channel activity. In disordered proteins, phosphorylation can tip the balance between order and disorder. Transitions can occur in both directions, so it is not currently possible to predict the effects of phosphorylation. We used single molecule fluorescence to characterize the effects of Src phosphorylation on GluN2B. Scanning fluorescent labeling sites throughout the domain showed no positional dependence of the energy transfer. Instead, efficiency only scaled with the separation between labeling sites suggestive of a relatively featureless conformational energy landscape. Src phosphorylation led to a general expansion of the polypeptide, which would result in greater exposure of known protein-binding sites and increase the physical separation between contiguous sites. Phosphorylation makes the CTD more like a random coil leaving open the question of how Src exerts its effects on the NMDA receptor.


Figures

FIGURE 1.
FIGURE 1.
Disorder in the C-terminal domain of GluN2B. A, known and unknown portions of the glutamate receptor structure. A schematic representation of the x-ray structure of an AMPA-sensitive glutamate receptor subunit (3KG2) (38) is depicted within a membrane (gray). The disordered C-terminal domain is drawn in approximate scale (circle). The CTD volume was calculated based on the assumption of a compact disordered globule (22), which is supported by our data. B, prediction of intrinsic disorder in the CTD. Probability of disorder is plotted for residues 838–1482. We analyzed the CTD with two major disorder predictors PONDR (dashed line) (20) and IUPRED (solid line) (21). Plot shows probability of disorder for each residue. The location of the palmitoylation sites is indicated by the gray vertical bars crossing the panel. The second palmitoylation site defines an intervening membrane binding region that partitions the CTD into two domains that we term CTD1 and CTD2. The location of the phosphorylation sites are inset at the bottom of the panel as black vertical bars.
FIGURE 2.
FIGURE 2.
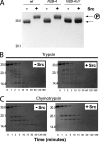
Src phosphorylation increases protease sensitivity of the GluN2B CTD2. A, effect of Src phosphorylation on the electrophoretic mobility of CTD2 during SDS-PAGE. Equal amounts of untreated and Src phosphorylated proteins were loaded on a 15% acrylamide gel. Position of the molecular weight markers is indicated to the left of the panel. For each sample, the 1st lane is untreated (−), and the 2nd lane has been phosphorylated (+). As indicated by the arrows to the right of the panel, phosphorylation decreased the apparent electrophoretic mobility. Representative samples of wild type CTD2, N2B-4, and N2B-4 ΔY, which lack the tyrosine phosphorylation sites (Y1336T and Y1472C) (Fig. 4A and Table 1), are shown, but all samples showed a similar shift, which was taken as diagnostic of phosphorylation. B, effect of phosphorylation on limited proteolysis of CTD2 by trypsin. Left, GluN2B wild type CTD2 was exposed to 0.002 mg/ml trypsin for the indicated time (minutes) before the addition of PMSF to stop the reaction. Right, same sample was Src-phosphorylated before the addition of protease. Position of the molecular weight markers is indicated to the left of the panel. C, effect of phosphorylation on limited proteolysis of CTD2 by chymotrypsin. Left, GluN2B wild type CTD2 was exposed to 0.002 mg/ml chymotrypsin for the indicated time (minutes) before the addition of PMSF to stop the reaction. Right, same sample was Src phosphorylated before the addition of protease. Position of the molecular weight markers is indicated to the left of the panel.
FIGURE 3.
FIGURE 3.
Phosphorylation does not induce secondary structure in the GluN2B CTD2. Near UV circular dichroism spectra of wild type CTD2 from GluN2B. Spectrum for the unphosphorylated protein is shown as open circles. Spectrum for the Src-phosphorylated protein is shown as filled circles. Data are plotted as molar ellipticity as the proteins are identical aside from the phosphotyrosine. Spectra were recorded in 10 mm phosphate, 50 mm NaCl at pH 7.5.
FIGURE 4.
FIGURE 4.
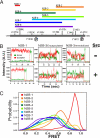
Single molecule FRET measurements of the GluN2B CTD2 conformation. A, constructs used in this experiment. Eight constructs of CTD2 were created that contained two unique cysteines for fluorescent labeling. Constructs were numbered in order of their fluorophore separation with NRB-1 being the shortest at 15 residues and NRB-8 being the longest at 172 residues (Table 1). The length and position of each construct are depicted as a bar above a scale representation of the primary sequence. The constructs overlap to sample the length of the polypeptide. The positions of cysteine residues used for labeling are indicated above the scale bar. Natural cysteines are indicated by capitalization. Phosphorylation sites are depicted below the scale bar. B, representative single molecule intensity time traces for unphosphorylated CTD2 (top row) and phosphorylated CTD2 (bottom row). Acceptor emission intensity is colored red. Donor emission intensity is colored green. Panels in the left column show representative single molecule intensity time traces for the control sample N2B-1 measured using the encapsulation method. Panels in the middle and right columns show representative single molecule intensity time traces of N2B-3 using the encapsulation and surface immobilization method, respectively. Additional representative data for the remaining samples are shown in supplemental Fig. S1. C, histograms of single molecule FRET for the eight labeling site combinations in CTD2. The histogram contains FRET values calculated for each 100 ms frame of observation. Histograms contain hundreds of molecules and were replicated in separate experiments. FRET is presented as normalized probability. Histograms are colored from red to violet in order of increasing fluorophore separation. N2B-1, red; N2B-2, orange; N2B-3, yellow; N2B-4, dark green; NRB-5, light green; N2B-6, cyan; N2B-7, blue; and N2B-8, violet.
FIGURE 5.
FIGURE 5.
Effect of Src phosphorylation on single molecule FRET in the GluN2B CTD2. A, single molecule FRET was measured for each FRET construct before and after Src phosphorylation. Constructs are shown in order of the fluorophore separation as indicated in each panel. The histogram contains FRET values calculated for each 100-ms frame of observation. Unphosphorylated proteins are shown as dashed lines. Phosphorylated proteins are shown as solid lines. B, median FRET for each distribution above plotted against the fluorophore separation in residues. Data were fit to a line using nonlinear least squares fitting. Unphosphorylated proteins are shown as open circles fit to a dashed line. Src-phosphorylated proteins are shown as filled squares fit to a solid line. Error bars are from replicate measurement of median FRET in separate experiments.
FIGURE 6.
FIGURE 6.
Effect of surface tethering on phosphorylation-induced conformational changes in the GluN2B CTD2. For these experiments, the palmitoylation sites in the N terminus of CTD2 were replaced with a biotinylation sequence, which allows for directional tethering of CTD2 to a passivated microscope slide. All labeling sites for FRET were identical to the previous experiments. A, single molecule FRET was measured for each FRET construct before and after Src phosphorylation. Constructs are shown in order of the fluorophore separation as indicated in each panel. The histogram contains FRET values calculated for each 100-ms frame of observation. Unphosphorylated proteins are shown as dashed lines. Phosphorylated proteins are shown in as solid lines. B, median FRET for each distribution above plotted against the fluorophore separation in residues. Data were fit to a line using nonlinear least squares fitting. Unphosphorylated proteins are shown as open circles fit to a dashed line. Src-phosphorylated proteins are shown as filled squares fit to a solid line. Error bars are from replicate measurement of median FRET in separate experiments.

Similar articles

Cited by

References

    1. Lau C. G., Zukin R. S. (2007) Nat. Rev. Neurosci. 8, 413–426 - PubMed
    1. Traynelis S. F., Wollmuth L. P., McBain C. J., Menniti F. S., Vance K. M., Ogden K. K., Hansen K. B., Yuan H., Myers S. J., Dingledine R., Sibley D. (2010) Pharmacol. Rev. 62, 405–496 - PMC - PubMed
    1. Köhr G., Seeburg P. H. (1996) J. Physiol. 492, 445–452 - PMC - PubMed
    1. Groc L., Bard L., Choquet D. (2009) Neuroscience 158, 4–18 - PubMed
    1. Cull-Candy S. G., Leszkiewicz D. N. (2004) Sci. STKE 2004, re16- - PubMed

Publication types

MeSH terms

LinkOut - more resources