. 2011 Jun 24;30(15):3078-90.
doi: 10.1038/emboj.2011.208.

The crystal structure of yeast CCT reveals intrinsic asymmetry of eukaryotic cytosolic chaperonins

Affiliations

The crystal structure of yeast CCT reveals intrinsic asymmetry of eukaryotic cytosolic chaperonins

Carien Dekker et al. EMBO J. .

Abstract

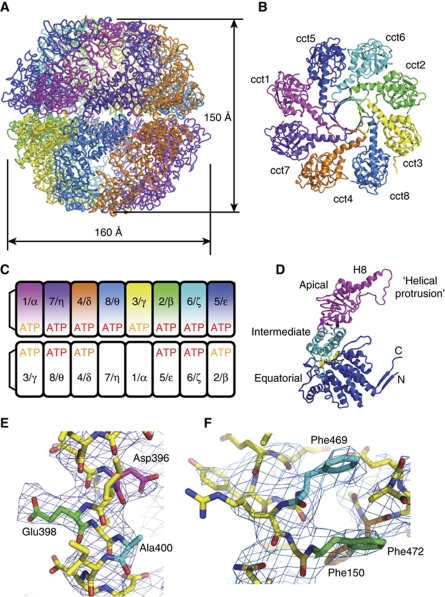
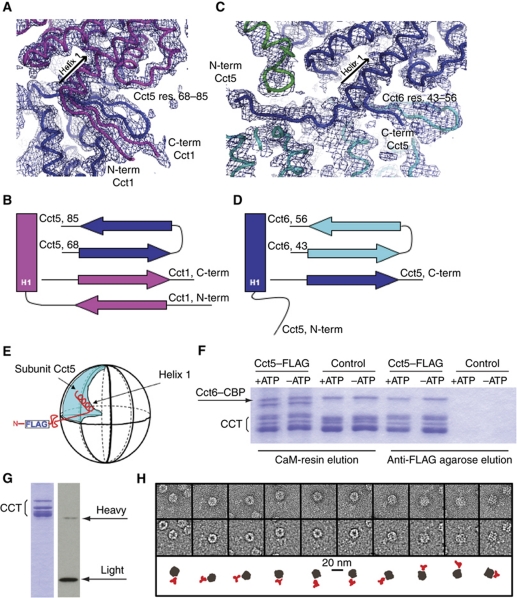
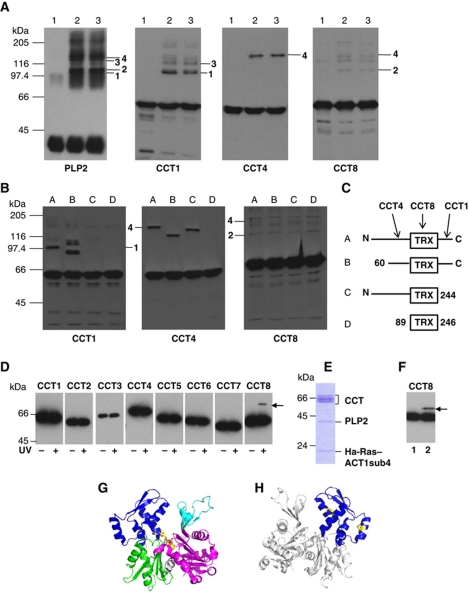
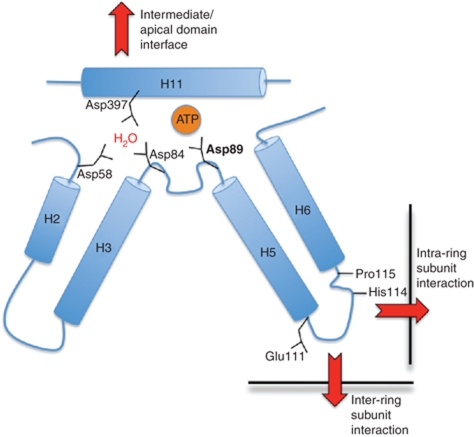
The cytosolic chaperonin CCT is a 1-MDa protein-folding machine essential for eukaryotic life. The CCT interactome shows involvement in folding and assembly of a small range of proteins linked to essential cellular processes such as cytoskeleton assembly and cell-cycle regulation. CCT has a classic chaperonin architecture, with two heterogeneous 8-membered rings stacked back-to-back, enclosing a folding cavity. However, the mechanism by which CCT assists folding is distinct from other chaperonins, with no hydrophobic wall lining a potential Anfinsen cage, and a sequential rather than concerted ATP hydrolysis mechanism. We have solved the crystal structure of yeast CCT in complex with actin at 3.8 Å resolution, revealing the subunit organisation and the location of discrete patches of co-evolving 'signature residues' that mediate specific interactions between CCT and its substrates. The intrinsic asymmetry is revealed by the structural individuality of the CCT subunits, which display unique configurations, substrate binding properties, ATP-binding heterogeneity and subunit-subunit interactions. The location of the evolutionarily conserved N-terminus of Cct5 on the outside of the barrel, confirmed by mutational studies, is unique to eukaryotic cytosolic chaperonins.


Conflict of interest statement

The authors declare that they have no conflict of interest.

Figures

Figure 1
Figure 1
(A) Overall structure of CCT with dimensions as shown. The colour scheme identifying the subunits is the same for all figures in this paper and reads Cct1=magenta, Cct2=green, Cct3=yellow, Cct4=orange, Cct5=blue, Cct6=cyan, Cct7=purple, Cct8=marine. (B) Top-down view of the apical domains of one ring, showing the non-symmetric iris-like closure of the helical protrusions, including helix H8, at the top of the complex. The views in (A) and (B) reveal the right-handed twist in each subunit. (C) Subunit organisation, showing both the nomenclature for yeast (numbers) and mammalian CCT (greek symbols) and the nucleotide occupancy in the crystal structure; nucleotide pockets that were fully occupied in both molecules in the asymmetric unit have ATP printed in red, nucleotide pockets that had nucleotide in one but not in the other molecule are printed in orange. Where no ATP was bound, an SO4 ion was modelled in the nucleotide pocket. (D) Domain structure of Group II chaperonin fold, with equatorial domain in blue, intermediate domain in cyan and apical domain in magenta; shown in yellow is a bound nucleotide. (E) The individual CCT chains were identified by careful inspection of density for unique stretches of sequence. The (2Fo-Fc) density is plotted at 1.0σ level. The absence of side-chain density for Ala400 (blue) and the presence of Glu398 (green) and Asp396 (magenta) indicate a sequence motif that is unique for Cct8. (F) Similarly, Phe150 (orange) occurs in both Cct5 and Cct6 but the combination with Phe469 (cyan) and Phe472 (green) makes this stretch unique to Cct5.
Figure 2
Figure 2
All N- and C-termini are involved in subunit–subunit interaction (A, B) except for Cct5 (C, D) where the N-terminus is at the periphery of the complex and threads through a channel formed by four subunits. In panels (AD), Cct5 is coloured blue, Cct1 is magenta, Cct6 is cyan and Cct2 is green, with (2Fo-Fc) density at 1.2σ. (E) Schematic representation of the expected location of the extreme N-terminus of Cct5 at the periphery of the complex, indicating the position of the FLAG-tag after residue number 9. (F) SDS–PAGE showing CCT pull-down using either CaM-resin or anti-FLAG agarose with or without ATP. The control is CCT complex harbouring the CBP-tag but not the FLAG-tag. (G) Coomassie-stained SDS–PAGE showing CCT in complex with anti-FLAG antibody in substoichiometric amounts. The heavy chain is just visible by Coomassie stain, as confirmed by western blot (right-hand panel). (H) Negative stain EM images of representative particles of CCT–FLAG in complex with anti-FLAG MAb. Top row: example of MAb complexes extracted from the raw micrographs; middle row: same molecular views low pass filtered to 30 Å to enhance the contrast; bottom row: cartoon representation of the complexes with CCT depicted in grey and the MAb in red.
Figure 3
Figure 3
(A) Western blotting analysis, with the eight anti-Cct subunit antibodies (McCormack et al, 2009), of CCT–3CBP complexes bound to CaM agarose after overnight incubation in low-glycerol buffer (5%) which destabilises yeast CCT. Unretained (top panels) is the supernatant sample containing subunits, which became unbound during the incubation. EGTA-eluted (bottom panels) is the material eluted from the column with 2 mM EGTA. (B) Subunit arrangement within and between the CCT rings highlighting, in red boxes, the Cct3, Cct2 and Cct6 neighbours that are retained on the column. The CBP-tagged Cct3 subunit is denoted by an asterisk.
Figure 4
Figure 4
(A) Residual density on the inside of the cavity is attributed to actin bound to CCT. One CCT ring with a slice of density to reveal the asymmetric distribution of the residual density with respect to the cavity is shown. The (2Fo-Fc) density calculated at 5 Å reveals β-strand features, showing the ‘actin’ density which is in the proximity of Cct1, Cct7 and Cct4. The Cct4 subunit is depicted in orange on the left-hand side of this slice. (B) Actin's ‘small’ domain (residues 1–137 from PDB entry 1ATN) drawn to the same scale as panel (A). (C) Signature residues (red) for CCT apical domains mapped onto the structure of the closed conformation. The view is from the inside of the cavity looking towards the ‘ceiling’ of the dome formed by the helical protrusions. Signature residues located near the ‘actin density’ are shown in green. (D) Schematic representation of view shown in (C); yellow denotes the patch of signature residues in the vicinity of the ‘actin density’.
Figure 5
Figure 5
(A) Crosslinking of sulfo-SDA-labelled yeast and rabbit actins to yeast CCT. Analysis of CCT–ACT1–PLP2 complexes by Coomassie-stained 8% SDS–PAGE (left-hand panel) or 6% native-PAGE and Typhoon imaging of the AlexaFluor-488-labelled yeast actin signal (right-hand panel). AlexaFluor-488-labelled yeast G-actin (ACT1) was coupled with sulfo-SDA and assembled into yeast CCT and PLP2 complexes as described in McCormack et al (2009). Lane 1 shows control complexes with sulfo-SDA-unlabelled actin. Lanes 2 and 3 show CCT-sulfo-SDA-labelled 488ACT1–PLP2 complexes assembled in ATPγS (lane 2) or in the absence of nucleotide (lane 3). All three samples were exposed to UV light for 30 min to induce crosslinking via the diazirine group. The ACT1 signal at 45 kDa is more diffuse in the Coomassie-stained SDS–PAGE analysis due to altered electrophoretic mobilities of the sulfo-SDA adducts of ACT1 (lanes 2 and 3; bracket) and higher molecular weight adducts are also visible (lanes 2 and 3; dotted bracket). However, all the 488ACT1 signals are equivalent in native-PAGE demonstrating that the sulfo-SDA crosslinking is compatible with complex assembly and stability. (B) Eight percent SDS–PAGE western blotting analysis of CCT–sulfo-SDA–labelled 488ACT1–PLP2 complexes. Replicate blots were probed with antibodies for all eight yeast CCT subunits or MAb-1f to PLP2 (McCormack et al, 2009). Four anti-CCT subunit antibody blots (CCT1, CCT7, CCT8 and CCT5) reveal species migrating between the 97.4 and 116 kDa markers (red dots) compatible with a crosslink formed between one chain of the respective CCT subunit and one ACT1 polypeptide. After collecting ECL exposures, these blots were washed and Typhoon scanned for the 488ACT1 signal 24 h later. The 488ACT1 signal was identical on all the blots as expected (only one shown here; labelled 488ACT1) and the main cluster of crosslinked products between 97.4 and 116 kDa is indicated with a bracket. No well-defined crosslinks were observed for PLP2. (C) Eight percent SDS–PAGE western blotting analysis of CCT SDA-rabbit α-actin PLP2 complexes; assembled as described for yeast actin. Replicate blots were probed with antibodies to all eight yeast CCT subunits or an mAb-C4 (Chemicon) to mammalian actins (McCormack et al, 2009). The anti-rabbit actin antibody blot (labelled ACTA) revealed a main cluster of crosslinked products between 97.4 and 116 kDa as indicated with a bracket. Three anti-CCT subunit antibody blots (CCT1, CCT7 and CCT8) reveal species migrating between the 97.4 and 116 kDa markers (red dots) compatible with a crosslink formed between one CCT subunit and one rabbit actin polypeptide. No well-defined crosslinks were observed for PLP2.
Figure 6
Figure 6
(A) Analysis of CCT–ACT1–sulfo-SDA–PLP2 complexes via 8% SDS–PAGE western blotting. PLP2 was coupled with sulfo-SDA and assembled into complexes by EDTA unfolding of ACT1 in the presence of yeast CCT (McCormack et al, 2009). Lane 1 shows control complexes with unlabelled PLP2. Lanes 2 and 3 show CCT–ACT1–SDA–PLP2 complexes with ATPγS added post assembly (lane 2) or in the absence of nucleotide (lane 3). All three samples were exposed to UV light for 30 min to induce crosslinking via the diazirine group. Replicate blots were probed with antibodies to all eight yeast CCT subunits or an mAb-1f to PLP2 (McCormack et al, 2009). Several higher molecular weight anti-PLP2 antibody species are detected and four are highlighted (RHS of PLP2 panel: 1, 2, 3 and 4). In the anti-CCT subunit blots species 1 and 3 overlay with anti-CCT1 antibody signals, species 2 overlays with an anti-CCT8 signal and species 4 overlays with both an anti-CCT4 signal and an anti-CCT8 signal (RHS of panels). (B) Eight percent SDS–PAGE western blotting analysis of CCT–ACT1–PLP2-deletion mutant complexes. PLP2 deletion mutants were previously described (McCormack et al, 2009) and are shown schematically in panel (C). Complexes with the mutant PLP2 proteins (lanes B–D) were prepared as described above for wild-type PLP2 (lane A). Replicate blots were probed with antibodies to the C-termini of all eight yeast CCT subunits or anti-PLP2 mAb-6i (McCormack et al, 2009). This analysis clearly maps the PLP2 interaction sites of the three CCT subunits (C shows mapping results arrowed). The ternary complex of PLP2–CCT4–CCT8 (species 4) with an apparent Mr 170 kDa is indicated in both the anti-CCT4 and anti-CCT8 blots. (C) The three PLP2 deletion mutants used in the analysis: wild-type PLP2 (A), N-terminal truncation; 60-C-terminus (B), C-terminal truncation; N-terminus-244 (C) and thioredoxin fold only; 89–246 (D) as previously described (McCormack et al, 2009). (D, E) Analysis of Ha-Ras–ACT1sub4 in complex with CCT and PLP2. The L-photo-methionine-labelled Ha-Ras–ACT1sub4 fusion protein was purified and refolded as previously described (McCormack et al, 2009). CCT–Ha-Ras–ACT1sub4–PLP2 complex was assembled and purified using 10–40% sucrose gradient sedimentation (McCormack et al, 2009). An aliquot of the peak fraction, electrophoresed on 12.5% SDS–PAGE and Coomassie stained is shown in panel (E) 200 μl of peak sucrose gradient fraction was irradiated with UV for 30 min on ice to initiate crosslinking. Samples were analysed on 10% SDS–PAGE western blots. Eight duplicate blots (plus and minus UV treatment step) were probed with antibodies to the C-termini of all eight yeast CCT subunits. A crosslinked species corresponding to CCT8–Ha-Ras–ACT1sub4 is clearly observed (D, arrow). (F) Analysis of ACT1sub4 in complex with CCT and PLP2. The ACT1sub4 protein was labelled in vivo in E. coli with L-photo-methionine as described in the legend to panel (D). The L-photo-methionine-labelled ACT1sub4 protein was purified and refolded as previously described (McCormack et al, 2009). CCT–ACT1sub4–PLP2 complex was assembled and purified by 10–40% sucrose gradient. 200 μl of peak sucrose gradient fraction with ATPγS added to a final concentration of 3.5 mM and was irradiated with UV for 30 min on ice to initiate crosslinking. Samples were analysed on 8% SDS–PAGE western blots and eight duplicate blots were probed with antibodies to all eight yeast CCT subunits; only the anti-CCT8 blot is shown; lane 1 minus L-photo-methionine crosslinker, lane 2 plus L-photo-methionine crosslinker (F). A single crosslinked species corresponding to CCT8–ACT1sub4 is observed (arrow) which migrates faster than the CCT8–Ha-Ras–ACT1sub4 species because it lacks the 90 amino-acid residues from Ha-Ras. Ha-Ras–ACT1sub4 is a fusion protein linking residues M67–L168 of Ha-Ras to residues I178–F262 of S. cerevisiae actin. Apart from the initiation methionine there are only two methionine residues in the ACT1sub4 protein (blue domain shown in panels G and H); M190 and M227 (coloured yellow in panel H) both located on the surface-exposed sides of helices on either side of the CCT-binding site II (McCormack et al, 2001a). Ha-Ras–ACT1sub4 fusion protein contains two additional methionines from the Ha-Ras domain, M72 and M111. (G) Schematic representation of the domain structure of actin, based on the actin chain in PDB entry 2BTF where domains 1 and 2 together form the ‘small domain’, and domains 3 and 4 combined the ‘large domain’. (H) View 180 degrees rotated relative to (G), showing the location of Cys374 at the C-terminus within domain 1, and the two methionines (in yellow ball-and-stick model) targeted by crosslinkers in domain 4.
Figure 7
Figure 7
Schematic representation of key allosteric elements involved in nucleotide binding and subunit–subunit interactions. The residue numbering corresponding to Cct6 and Asp89 is in bold as this is the catalytic Asp in the GDGTT motif which is strictly conserved in all chaperonins and was mutated to Glu in each of the eight Cct subunits in a study by Amit et al (2010). Cct8 is the only subunit not to contain aspartate at the residue equivalent to Cct6, Asp84; instead, the residue at position 93 is lysine. Red arrows indicate the direction in which nucleotide-induced conformational changes can be transduced throughout the structure.
Figure 8
Figure 8
Side by side comparison of yeast CCT X-ray model and bovine CCT EM model. Shown is a characteristic stretch of sequence in the equatorial domain that according to Cong et al (2010) displays a unique fit that allowed subunit identification (see Cong et al, 2010 and Supplementary Figure S4). Since the subunit order within one ring is predicted to be different in the two models, a simple yeast Cct5-bovine Cct5 comparison has no meaning. Instead, the two-fold symmetry axis was taken as point of reference, assuming that this symmetry axis is the same in both models. If this assumption holds true, then yeast Cct5 is located at 45° with respect to the two-fold axis and bovine Cct5 is located at 90° with respect to the two-fold axis as shown schematically in the ring diagrams in panel (A). Therefore, the data sets need to reflect the distinction between a 45° and 90° location, for example, between Cct5 and Cct4 in the bovine structure, corresponding to Cct1 and Cct5, respectively, in the yeast model. (A) Ring diagrams of top views of the yeast X-ray structure (this study) and the bovine electron microscopy model of Cong et al (2010). The Cct5 subunit is indicated in red in each model and the two-fold axis is indicated by the blue line. (B) Alignment of the yeast Cct1–8 and bovine Cct4 and Cct5 amino-acid sequences N-terminal to the GDGTT motif region located in the equatorial domain of all CCT subunits. The 3.8-Å CCT X-ray model is shown in panels (CE) in the 2Fo-Fc density map, plotted at 1.1σ. (C) Density and X-ray model for Cct1 residues 95–130 with His 121 and Pro 122 in green. (D) Density and X-ray model for Cct5 residues 116–151 with His 142 and Pro 143 in green and Ile 144 and Lys 145 in cyan corresponding to the unique bovine Ile 109 and Arg 110 as marked out by Cong et al (2010) and highlighted in red in the bovine Cct5 sequence in the alignment above in (B). (E) The same as (D) but showing only Cα tracing to allow comparison with EM model. (F) Density at 4.7 Å (emd_5145) and EM model for bovine Cct5 for which only Cα-coordinates are available in the PDB (entry 3IYG). (G) Density at 4.0 Å (emd_5148) and EM model for bovine Cct5. (H) Density at 4.0 Å and EM model for bovine Cct4. Density figures were created using the author's recommended contour levels as indicated in the EMDB entry.

Similar articles

Cited by

References

    1. Adams PD, Grosse-Kunstleve RW, Hung L-W, Ioerger TR, McCoy AJ, Moriarty NW, Read RJ, Sacchettini JC, Sauter NK, Terwilliger TC (2002) PHENIX: building new software for automated crystallographic structure determination. Acta Crystallogr D Biol Crystallogr 58: 1948–1954 - PubMed
    1. Altschuler GM, Dekker C, McCormack A, Morris EP, Klug DR, Willison KR (2009) A single amino acid residue is responsible for species-specific incompatibility between CCT and alpha-actin. FEBS Lett 583: 782–786 - PubMed
    1. Amit M, Weisberg SJ, Nadler-Holly M, McCormack EA, Feldmesser E, Kaganovich D, Willison KR, Horovitz A (2010) Equivalent mutations in the eight subunits of the chaperonin CCT produce dramatically different cellular and gene expression phenotypes. J Mol Biol 401: 532–543 - PubMed
    1. Cong Y, Baker ML, Jakana J, Woolford D, Miller EJ, Reissmann S, Kumar RN, Redding-Johanson AM, Batth TS, Mukhopadhyay A, Ludtke SJ, Frydman J, Chiu W (2010) 4.0-A resolution cryo-EM structure of the mammalian chaperonin TRiC/CCT reveals its unique subunit arrangement. Proc Natl Acad Sci USA 107: 4967–4972 - PMC - PubMed
    1. Dekker C, Stirling PC, McCormack EA, Filmore H, Paul A, Brost RL, Costanzo M, Boone C, Leroux MR, Willison KR (2008) The interaction network of the chaperonin CCT. EMBO J 27: 1827–1839 - PMC - PubMed

Publication types

MeSH terms