. 2011 Jun 24;30(14):2762-78.
doi: 10.1038/emboj.2011.198.

Human MIEF1 recruits Drp1 to mitochondrial outer membranes and promotes mitochondrial fusion rather than fission

Affiliations

Human MIEF1 recruits Drp1 to mitochondrial outer membranes and promotes mitochondrial fusion rather than fission

Jian Zhao et al. EMBO J. .

Abstract

Mitochondrial morphology is controlled by two opposing processes: fusion and fission. Drp1 (dynamin-related protein 1) and hFis1 are two key players of mitochondrial fission, but how Drp1 is recruited to mitochondria and how Drp1-mediated mitochondrial fission is regulated in mammals is poorly understood. Here, we identify the vertebrate-specific protein MIEF1 (mitochondrial elongation factor 1; independently identified as MiD51), which is anchored to the outer mitochondrial membrane. Elevated MIEF1 levels induce extensive mitochondrial fusion, whereas depletion of MIEF1 causes mitochondrial fragmentation. MIEF1 interacts with and recruits Drp1 to mitochondria in a manner independent of hFis1, Mff (mitochondrial fission factor) and Mfn2 (mitofusin 2), but inhibits Drp1 activity, thus executing a negative effect on mitochondrial fission. MIEF1 also interacts with hFis1 and elevated hFis1 levels partially reverse the MIEF1-induced fusion phenotype. In addition to inhibiting Drp1, MIEF1 also actively promotes fusion, but in a manner distinct from mitofusins. In conclusion, our findings uncover a novel mechanism which controls the mitochondrial fusion-fission machinery in vertebrates. As MIEF1 is vertebrate-specific, these data also reveal important differences between yeast and vertebrates in the regulation of mitochondrial dynamics.


Conflict of interest statement

The authors declare that they have no conflict of interest.

Figures
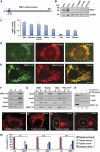
Figure 1
Figure 1
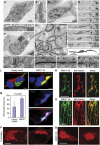
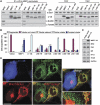
The protein structure, expression and subcellular localization of MIEF1. (A) MIEF1 is an integral outer mitochondrial membrane protein with an N-terminal TM domain. (B) Endogenous MIEF1 in various cell lines was immunoblotted using anti-MIEF1 antibody. (C) Real-time PCR analysis of MIEF1 expression in normal human adult tissues. Levels of MIEF1 mRNA were determined relative to β-actin. Data were from three independent experiments. (D, E) Both endogenous MIEF1 and exogenous MIEF1-V5 were localized to mitochondria, stained with anti-MIEF1 antibody (green) and MitoTracker Red (red). (F) The distribution of MIEF1-V5, Tim23, Tom20 and GAPDH was analysed in whole-cell lysate (W), cytosolic fraction (C) and mitochondrial fraction (M). (G) Mitochondrial fractions prepared from 293T cells expressing MIEF1-V5 were resuspended in the mitochondrial buffer (buffer) alone as control, or in buffers containing 0.1 M Na2CO3 (pH 11.5), 1 M NaCl or 1% Triton X-100 followed by centrifugation, and the membrane pellets (P) and supernatant fractions (S) were immunoblotted with indicated antibodies. (H) Mitochondrial fractions were digested with PK in the absence (lane 2) or presence (lane 3) of 1% Triton X-100 (Tx-100) for 30 min or with mock control (lane 1) and analysed for MIEF1-V5, Tim23 and Tom20. (IL) Mitochondrial morphology in 293T cells transfected with empty vector (I, J) and MIEF1-V5 (K, L) was analysed by confocal microscopy after double staining with MitoTracker and anti-V5 antibody (not shown). Outlines of the nucleus (Nu) and the cell are drawn in dash line. (M) Percentages (mean±s.e.m.) of 293T cells with indicated mitochondrial morphologies at indicated time points post-transfection for empty vector (Ctr) transfected cells (n=495 for 6 h; n=558 for 12 h; n=568 for 24 h) and for MIEF1-V5 transfected cells (n=427 for 6 h; n=735 for 12 h; n=776 for 24 h). Data were from three independent experiments. Bars, 10 μm.
Figure 2
Figure 2
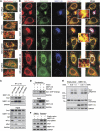
MIEF1 promotes mitochondrial elongation and fusion. (A) Electron micrograph of mitochondria in a non-transfected cell. (B) The mitochondrion boxed in (A) at high magnification. (C) A locally magnified mitochondrion boxed in (B). (D) Electron micrograph in a MIEF1-V5 transfected cell, with an elongated tubular cluster of mitochondria (corresponding to the image in Figure 1K). An elongated mitochondrion in the box was followed from the perinuclear region to the cell surface. (E) Serial ultrathin sections (E1–8) and a reconstruction (E9) from the serial sections of the giant mitochondrion boxed in (D). (F) Electron micrograph of mitochondria in a MIEF1-V5 transfected cell with a compact cluster of mitochondria in the perinuclear region (corresponding to the image in Figure 1L). (G) The magnified compact cluster of mitochondria boxed in (F). Arrows indicate mitochondrial membranes in the fusion process. (H) A locally magnified compact cluster of mitochondria. The areas pointed by arrows were further magnified in (I, K). (IK) Locally magnified electron micrographs of the mitochondrial membrane structure in compact clusters illustrate how the two outer membranes between tethered mitochondria become indistinguishable (I) and undergo fusion (J, K, arrows). IM, the inner membrane; OM, the outer membrane. (L) Cocultured 293T cells expressing mito-GFP or mito-DsRed were transfected with empty vector or MIEF1-V5 and fused with PEG. Polykaryons were analysed by confocal microscopy and mitochondrial fusion was measured by colocalization of mito-GFP or mito-DsRed. (M) Mitochondrial fusion was quantified by using the colocalization model of LAS AF software. At least 20 polykaryons were analysed in each of two independent experiments. Bars, 10 μm. (N) Confocal images show accumulation of MIEF1-V5 as punctate structures at the connection sites between two mitochondrial units (arrows) and at the tips of mitochondrial tubules (arrowheads). (O) Mitochondria had undergone MIEF1-V5-induced elongation. Distinct foci of MIEF1-V5 were observed (arrows). Bars, 5 μm. (P, Q) Mitochondrial morphology in 293T cells expressing FLAG-Mfn2 or MIEF1-V5 was observed by confocal microscopy after double staining with MitoTracker and either anti-V5 or anti-FLAG antibody (not shown). Bars, 10 μm.
Figure 3
Figure 3
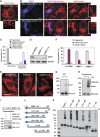
Mfn2 is not essential for MIEF1-induced mitochondrial fusion and MIEF1 exhibits oligomerization. (A) Confocal images show fragmented mitochondria in HeLa cells depleted of Mfn2 by siRNA (siMfn2–3). (B) Expression of MIEF1-V5 reverses Mfn2 RNAi-induced fragmentation, resulting in mitochondrial elongation in Mfn2-depleted HeLa cells. Bars, 10 μm. (C) Percentages (mean±s.e.m.) of cells with indicated mitochondrial morphologies in Mfn2 RNAi-treated HeLa cells in the presence or absence of exogenous MIEF1-V5. At least 200 cells in several fields were counted in two independent experiments. (D) HeLa cells were transfected with two MIEF1-specific siRNAs as indicated, or with a scrambled control siRNA (Ctr-siRNA), and analysed by immunoblotting with anti-MIEF1 antibody. (E) Representative confocal images of mitochondrial morphologies in HeLa cells transfected with Ctr-siRNA, siMIEF1-1 or siMIEF1-2 were stained with MitoTracker. Bar, 20 μm. (F) Percentages (mean±s.e.m.) of cells with indicated mitochondrial morphologies after transfection with siRNAs as indicated. At least 500 cells in several fields were counted in three independent experiments. (G) Cell extracts of 293T cells expressing MIEF1-V5 were separated by SDS-gel electrophoresis in the presence (+) or absence (−) of DTT followed by western blot with anti-V5 antibody. Under non-reducing conditions, a dimer with the molecular mass of ∼110 kDa was seen in addition to the ∼56 kDa monomer of MIEF1-V5. (H) 293T cells expressing MIEF1-V5 were chemically crosslinked with (+) or without (−) FA, and cell lysates were immunoblotted with anti-MIEF1 antibody. Several high molecular weight bands were seen under FA crosslinking conditions. (I) 293T cells were cotransfected with HA-MIEF1 and either MIEF1-V5 or empty vector, and cell lysates were subjected to IP with anti-V5 agarose followed by immunoblotting with indicated antibodies. (J) Schematic representation of deletion mutants of MIEF1 fused to a C-terminal V5-tag. (K) 293T cells expressing the indicated deletion mutants of MIEF1 were chemically crosslinked with (+) or without (−) FA, followed by immunoblotting with anti-V5 antibody.
Figure 4
Figure 4
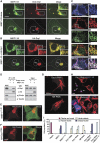
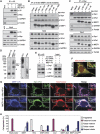
MIEF1 interacts and colocalizes with Drp1 on mitochondria. (A) Confocal images show that MIEF1-V5 was colocalized with endogenous Drp1 (endo Drp1) in the tubular cluster (upper panel) and in the compact cluster of mitochondria (lower panel) in 293T cells expressing MIEF1-V5. Insets represent magnifications of the boxed areas. MIEF1 and Drp1 were colocalized in punctate structures on mitochondria (arrows). (B) Exogenously expressed MIEF1-V5 and HA-Drp1 were colocalized on mitochondria of 293T cells. Outlines of the nucleus (Nu) and the cell in (A, B) are drawn in dash lines. (C) Confocal images show the colocalization of endogenous MIEF1 and Drp1 as punctate structures on mitochondria. Cells were triple stained using MitoTracker (blue) followed by anti-MIEF1 (red) and anti-Drp1 (green) antibodies. Insets represent magnifications of the boxed areas. (D) After transfection with empty vector or MIEF1-V5, cell lysates of 293T cells were subjected to IP with anti-V5 agarose, and the precipitated complexes were analysed by western blot (WB) with indicated antibodies. WCE, whole cell extract from non-transfected cells. (E, F) Confocal images show mitochondrial morphology in 293T cells expressing either MIEF1Δ1−48 or HA-Drp1K38A. (G) Confocal images of mitochondria stained with MitoTracker in 293T cells depleted of Drp1 or Mff by siRNA (siDrp1-1, siMff-1). (H) Confocal images of mitochondria stained with MitoTracker in Drp1 RNAi-treated 293T cells expressing MIEF1-V5 or MIEF1Δ1−48 stained with anti-V5 antibody (blue, arrows). (I) Percentages (mean±s.e.m.) of cells with indicated mitochondrial morphologies in 293T cells transfected with empty vector (n=497), MIEF1-V5 (n=776), MIEF1Δ1−48 (n=409), HA-Drp1K38A (n=289), Drp1 RNAi (n=319), Mff RNAi (n=303), Drp1 RNAi+MIEF1-V5 (n=301) and Drp1 RNAi+MIEF1Δ1−48 (n=119). Data were determined from two or three independent experiments. Bars, 10 μm.
Figure 5
Figure 5
MIEF1 recruits cytoplasmic Drp1 to mitochondria. (A) Confocal images show the distribution of endogenous Drp1 (endo Drp1) in non-transfected 293T cells. Insets represent magnifications of the boxed areas. (B) Confocal images show that endogenous Drp1 was recruited to mitochondria from the cytoplasm in 293T cells overexpressing MIEF1-V5. (C) Subcellular fractionation followed by immunoblotting show an increase of Drp1 in the mitochondrial fraction and a decrease of Drp1 in the cytosolic fraction in 293T cells overexpressing MIEF1-V5. Tom20 and GAPDH were used as markers for mitochondrial and cytosolic fractions, respectively. (D) Overexpression of the GTPase-inactive Drp1K38A alone resulted in aggregated structures (green) of HA-Drp1K38A in the cytoplasm. 293T cells were double stained with MitoTracker and anti-HA antibody. (E) Cotransfection with MIEF1-V5 recruited HA-Drp1K38A to mitochondria and MIEF1-V5 and Drp1K38A colocalized in mitochondrial clusters. 293T cells were cotransfected, and stained with MitoTracker followed by immunostaining with anti-V5 (blue) and anti-HA (green) antibodies. (F) Cell lysates of 293T cells transfected with indicated plasmids were subjected to IP with anti-V5 agarose, and the precipitated complexes were analysed by western blot (WB) with indicated antibodies. Outlines of the nucleus (Nu) and the cell in (B, D and E) are drawn in dash line. Bars, 20 μm.
Figure 6
Figure 6
MIEF1's interaction with Drp1 rather than its mitochondrial localization is crucial for the MIEF1-induced mitochondrial fusion phenotype. (A) Cell lysates of 293T cells transfected with empty vector, wild-type and various mutants of MIEF1-V5, as indicated, were immunoprecipitated with anti-V5 agarose, and the precipitated complexes were analysed by western blot (WB). WCE, whole cell extract from non-transfected cells. Note that the MIEF1Δ160−169 mutant does not bind Drp1 and that the MIEF1Δ431−463 mutant binds only weakly. (B) Percentages (mean±s.e.m.) of cells with indicated mitochondrial morphologies in 293T cultures transfected with empty vector (n=582), wild-type MIEF1-V5 (n=815), MIEF1Δ1−48 (n=302) MIEF1Δ66−79 (n=455), MIEF1Δ92−103 (n=481), MIEF1Δ130−139 (n=517), MIEF1Δ160−169 (n=663) as well as MIEF1Δ431−463 (n=495) plasmids. Data were from three independent experiments. (C) Immunoblotting analysis of Drp1, hFis1, Mff, Mfn2 and Tim23 in 293T cells transfected with empty vector and MIEF1-V5. (D) Confocal images show that overexpression of MIEF1Δ1−48, which was cytoplasmically located due to lack of the TM domain but retained the ability to bind Drp1, resulted in reduced distribution of Drp1 in mitochondria compared to in the adjacent non-transfected 293T cells. Bar, 20 μm.
Figure 7
Figure 7
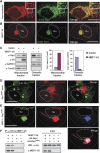
hFis1, Mfn2 and Mff are not required for MIEF1-mediated recruitment of Drp1 to mitochondria. (A) Distribution of endogenous Drp1 in control and HeLa cells depleted of hFis1, Mfn2 or Mff by RNAi (siFis1–3, siMfn2–3 or siMff-1), followed by confocal microscopy using MitoTracker Red staining and immunostaining with anti-Drp1 (green) antibody. (B) Distribution of endogenous Drp1 in hFis1, Mfn2 or Mff RNAi-treated HeLa cells expressing MIEF1-V5. Insets in (A, B) are magnifications of the boxed areas. Bars, 10 μm. (C) HeLa cells depleted of hFis1, Mfn2 or Mff by RNAi were further transfected with MIEF1-V5 and subjected to IP with anti-V5 agarose, and the precipitated complexes were analysed by western blot with indicated antibodies. (D) GTP binding of both endogenous Drp1 and exogenous HA-Drp1 was analysed by GTP-agarose pull down in 293T cells transfected with MIEF1-V5 alone, or cotransfected with MIEF1-V5 and HA-Drp1. (E) Immunoblotting to illustrate the oligomerization of endogenous Drp1 in 293T cells transfected with empty vector or MIEF1-V5 and crosslinked with DSS at indicated concentrations. (F) 293T cells transfected with empty vector or MIEF1-V5 were after 24 h incubated in the presence or absence of forskolin (20 μM), and cell extracts were immunoblotted using Phospho-DRP1 (Ser637) antibody and indicated antibodies.
Figure 8
Figure 8
The interaction of MIEF1 with hFis1 is independent of its interaction with Drp1 and overexpression of hFis1 partially reverses the MIEF1-induced mitochondrial fusion phenotype. (A) Cell lysates of 293T cells cotransfected with indicated plasmids were subjected to IP with anti-V5 agarose, and the precipitated complexes were immunoblotted with indicated antibodies. (B) MIEF1-V5 deletion mutants with no or reduced Drp1 binding (MIEF1Δ160−169 and MIEF1Δ431−463) and the cytoplasmic MIEF1Δ1−48 mutant had no effect on the binding between MIEF1 and hFis1. Cell lysates of 293T cells cotransfected with Myc-hFis1 and indicated MIEF1-V5 wild-type and mutant plasmids were subjected to IP with anti-V5 agarose and the precipitated complexes were immunoblotted with indicated antibodies. (C) Cell lysates of 293T cells cotransfected with Myc-hFis1 and indicated MIEF1-V5 wild-type and mutant plasmids were immunoprecipitated with anti-Myc agarose and the precipitated complexes were immunoblotted with indicated antibodies. (D) Native complexes of MIEF1, Drp1 and hFis1 were determined by NGE. Lysates from cells transfected with MIEF1-V5 and crosslinked with DSS (1 mM) were subjected to NGE followed by immunoblotting with indicated antibodies. Note: Lane 2 is the same blot as lane 1 that was reprobed with anti-Drp1 antibody after immunoblotting with anti-V5 antibody, and lanes 3 and 4 were probed using anti-Drp1 and hFis1 antibodies, respectively. (E) Cell lysates from Drp1 RNAi-treated HeLa cells cotransfected with MIEF1-V5 and Myc-hFis1 were subjected to IP with anti-V5 agarose, and the precipitated complexes were immunoblotted with indicated antibodies. (F) Confocal images of 293T cells transfected with Myc-hFis1 alone. Inset represents magnification of the boxed area. (G) Confocal images of 293T cells cotransfected with MIEF1-V5 and Myc-hFis1, and stained with MitoTracker followed by immunostaining with anti-V5 (blue) and anti-Myc (green) antibodies. Insets represent magnifications of the boxed areas. Bars, 10 μm. (H) Percentages (mean±s.e.m.) of cells with indicated mitochondrial morphologies in 293T cultures either transfected with empty vector (n=570), MIEF1-V5 (n=671), HA-Drp1 (n=405) and Myc-hFis1 (n=706) plasmid alone, or cotransfected with MIEF1-V5+HA-Drp1 (n=501), MIEF1-V5+HA-Drp1K38A (n=585) and MIEF1-V5+Myc-hFis1 (n=546) plasmids. Data were from three independent experiments.
Figure 9
Figure 9
MIEF1 affects the sensitivity of cells to apoptotic stimuli and the activity of autophagy. (A) Confocal images show that MIEF1-V5 overexpression did not induce release of cytochrome c (cyt c), Smac/Diablo or AIF from mitochondria in 293T cells transfected with MIEF1-V5. Cells were immunostained with the indicated antibodies and nuclei were stained with DAPI. Bar, 20 μm. (B) PARP cleavage was analysed by immunoblotting of extracts from 293T cells transfected with empty vector (control) and MIEF1-V5. (C) The levels of LC3B-I and LC3B-II were analysed by immunoblotting of extracts from 293T cells transfected with empty vector (control) and MIEF1-V5. (D) PARP cleavage was analysed in extracts of HeLa cells transfected with MIEF1-V5 or empty vector and treated with STS (1.5 μM) for indicated time points. (E) PARP cleavage was analysed in extracts of HeLa cells transfected with control siRNA (Ctr-siRNA) or siMIEF1-1 and -2 and treated with STS (1.5 μM) for indicated time points.

Comment in

Similar articles

Cited by

References

    1. Berman SB, Pineda FJ, Hardwick JM (2008) Mitochondrial fission and fusion dynamics: the long and short of it. Cell Death Differ 15: 1147–1152 - PMC - PubMed
    1. Chan DC (2006) Mitochondrial fusion and fission in mammals. Ann Rev Cell Dev Biol 22: 79–99 - PubMed
    1. Chang CR, Blackstone C (2007) Cyclic AMP-dependent protein kinase phosphorylation of Drp1 regulates its GTPase activity and mitochondrial morphology. J Biol Chem 282: 21583–21587 - PubMed
    1. Chen H, Chomyn A, Chan DC (2005) Disruption of fusion results in mitochondrial heterogeneity and dysfunction. J Biol Chem 280: 26185–26192 - PubMed
    1. Cribbs JT, Strack S (2007) Reversible phosphorylation of Drp1 by cyclic AMP-dependent protein kinase and calcineurin regulates mitochondrial fission and cell death. EMBO Rep 8: 939–944 - PMC - PubMed

Publication types

MeSH terms