. 2011 Jul 8;146(1):37-52.
doi: 10.1016/j.cell.2011.06.001. Epub 2011 Jun 23.

Gaucher disease glucocerebrosidase and α-synuclein form a bidirectional pathogenic loop in synucleinopathies

Affiliations

Gaucher disease glucocerebrosidase and α-synuclein form a bidirectional pathogenic loop in synucleinopathies

Joseph R Mazzulli et al. Cell. .

Abstract

Parkinson's disease (PD), an adult neurodegenerative disorder, has been clinically linked to the lysosomal storage disorder Gaucher disease (GD), but the mechanistic connection is not known. Here, we show that functional loss of GD-linked glucocerebrosidase (GCase) in primary cultures or human iPS neurons compromises lysosomal protein degradation, causes accumulation of α-synuclein (α-syn), and results in neurotoxicity through aggregation-dependent mechanisms. Glucosylceramide (GlcCer), the GCase substrate, directly influenced amyloid formation of purified α-syn by stabilizing soluble oligomeric intermediates. We further demonstrate that α-syn inhibits the lysosomal activity of normal GCase in neurons and idiopathic PD brain, suggesting that GCase depletion contributes to the pathogenesis of sporadic synucleinopathies. These findings suggest that the bidirectional effect of α-syn and GCase forms a positive feedback loop that may lead to a self-propagating disease. Therefore, improved targeting of GCase to lysosomes may represent a specific therapeutic approach for PD and other synucleinopathies.


Figures

Figure 1
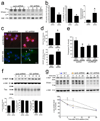
Figure 1. GCase knock-down compromises lysosomal degradation and causes accumulation of α-syn
A) KD of GCase protein in cortical neurons by GCase shRNA is shown by western blot. Neural specific enolase (NSE) was used as a loading control. Four replicates are shown. Scrb, scrambled shRNA B) Left, GCase protein levels (n=6, *p<0.01). Middle, Enzymatic activity of GCase (n=6, *p<0.01). Right, Intracellular GlcCer quantification by MS (Pi, phosphate) (n=3, *p<0.05). C) GlcCer immunofluorescence (top, red) and neutral lipids were visualized by BODIPY 493 fluorescence (bottom, green). Nuclei were visualized with DAPI (blue). The arrows indicate cells with increased diffuse staining, while the arrow head indicates a cell with punctated lipid accumulations. D) Fluorescent intensity shown in c was quantified and normalized to DAPI (n=3, *p<0.05). E) Proteolysis of long-lived proteins in neurons assessed at 8hrs. Lysosomal inhibitors leupeptin (leu) and ammonium chloride (NH4Cl) were used (n=4, *p<0.05). F) Western blot of endogenous α-syn (mAb syn202) and Tau. Four replicates are shown. Protein and mRNA levels are shown under the blots (n=4, *p<0.05). α-Tub was used as a loading control. G) α-Syn analysis in inducible H4 cells. Expression was turned off by doxycycline (DOX) and protein clearance was measured by western blot with mAb syn211. Quantifications are shown below (n=6, *p<0.05). GCase KD is shown by western blot and α-tub was used as a loading control. MW is indicated in kDa. For all analyses, values are the mean ± SEM. See also Figure S1.
Figure 2
Figure 2. Compromised proteolysis of long-lived proteins and specific accumulation of endogenous α-syn in human GD dopaminergic neurons
A) Immunofluorescence analysis of wt and GD neurons generated from iPS cells with the neuronal marker β III tubulin (green) and catecholaminergic marker tyrosine hydroxylase (TH, red). Nuclei (DAPI) are shown in blue. Scale bars=10µm. B) Western blot analysis of GCase. NSE was used as a loading control. Bottom, quantification of GCase activity (n=3, *p<0.05). C) Long-lived protein degradation was assessed as in Figure 1e. (n=4, *p<0.05). Inset, proteolysis of short-lived proteins (15 minutes post-chase). D) α-Syn immunofluorescence analysis using mAb LB509 (red). β III tubulin, green. Scale bar=30µm. E) Western blot of T-sol lysates from iPS neurons. Htt, huntingtin; CBB, coomassie brilliant blue. F) Quantification of α-syn, tau, and Htt protein by western blot. Protein levels were normalized to α-tub. (n=3, values are the mean ± SEM, formula imagep<0.01 compared to wt α-syn, wt and GD tau, and wt and GD Htt; *p<0.05 compared to wt tau).
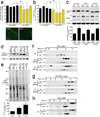
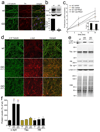
Figure 3
Figure 3. GCase depletion enhances α-syn mediated neurotoxicity through aggregation dependent mechanisms
Neurons expressing human α-syn proteins and GCase shRNA were analyzed at 7 dpi. A) Neurofilament immunostaining was used to monitor neurite degeneration. Representative neurofilament immunofluorescence staining (green) in wt α-syn expressing neurons is shown below. Nuclei (DAPI) are shown in blue. Scale bars=10µm. B) Neurotoxicity was assessed by neuronal volume analysis. (for A and B: n=8, *p<0.001). C) Protein levels of human wt, A53T, and Δ71–82 α-syn (T-sol) by western blot. α-tub was used as a loading control. Quantification is shown below (n=6, *p<0.01). (D) α-Syn western blot of T-sol fractions. (leu, leupeptin; NT, not transduced). NSE was used as a loading control. (E) Western blot of T-insoluble α-syn. Quantification is shown below. The brackets show the signal used for quantification (n=3, *p<0.05, **p<0.01 compared to scrb control). F–H) Native SEC/western blot analysis of T-sol lysates. (Å, radius in angstroms). NSE was used as a loading control. Oligomeric α-syn (Void->64Å) was quantified in the graph (n=3, values are the mean ± SEM, *p<0.05). MW is indicated in kDa for each blot. See also Figure S3.
Figure 4
Figure 4. GlcCer directly influences the in vitro fibril formation of recombinant α-syn and stabilizes soluble oligomeric species
A) Purified α-syn was incubated with mixtures of PC and GlcCer at pH 5.0, 37°C and amyloid formation was assessed by thioflavin T fluorescence (relative fluorescence units (RFU), n=4, *p<0.01). B) Analysis of 100,000 × g soluble α-syn at 1 and 5hrs by SEC (115-38 Å and 36-27 Å fractions), then SDS-PAGE/western blot (syn211). The MW is indicated in kDa. C) Soluble oligomers were quantified by densitometry (n=3, *p <0.05). D) ANS fluorescence of α-syn species formed after 1 hr. (n=4, *p<0.01). E) Centrifugal sedimentation analysis at 28 hrs. (s, supernatant; p, pellet). α-Syn was detected with coomassie brilliant blue staining. Pelletable α-syn was quantified in the graph below (n=3). Amyloid was measured from the same reactions by thioflavin T (n=4, *p<0.01). F) EM analysis of α-syn aggregates showing a mixture of fibrillar (i–iii) and amorphous (iv–v) structures at 24 hrs. Panels ii–v show immmuno-EM analysis using mAb syn505. Scale bars: 100nm for i–iii; 500nm for iv,v. G) Immuno-EM analysis with syn505 of α-syn+PC25/GlcCer75 reactions at 15 hrs. GlcCer lipid tubules are ~50nm in width. Scale bars: 100nm for i, iii; 500nm for ii. H) Immuno-EM analysis with syn505 of α-syn+PC25/GlcCer75 reactions at 24 hrs showing fibrillar structures of 10-14nm in width with twisted (i) or straight (ii) morphologies which appear to extend from GlcCer tubules. Scale bars: 100nm. I) Immuno-EM analysis of GlcCer lipid dispersions alone. Scale bar: 100nm. For each graph in a,c–e, values are the mean ± SEM. See also Figure S4.
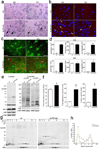
Figure 5
Figure 5. α-Syn accumulation and soluble oligomer formation in GD mice. Analysis of 12 week old GD mice (4L/PS-NA)
A) H & E stain of the substantia nigra (SN) and cortex (Ctx). The arrows indicate eosinophilic spheroids. Scale bars =50µm. B) Immunofluorescence of α-syn (red) in SN and Ctx. Nuclei are stained with DAPI (blue). Scale bars=20µm. C) Co-staining of α-syn (red) and neuronal marker NeuN (green). Scale bars=20µm. D) Left, Quantification of neuronal spheroids. N.D., not detected. Middle, Quantification of neuronal number by NeuN immunostaining. Right, Quantification of α-syn aggregates by immunostaining. E) Sequential extraction analysis of Ctx. pAb SNL-1 and mAb syn202 detect total endogenous α-syn, while syn505 detects oxidized/nitrated and misfolded α-syn.. NSE and α-tub were used as loading controls. F) Quantification of T-sol monomers (18kDa, left) T-sol oligomers (>18kDa, middle), and T-insoluble α-syn (total lane, right). G) Native SEC/SDS-PAGE/western blot of T-sol fractions. Radius, Å H) Chromatographic profile obtained by syn202 densitometry. The values are representative of independent SEC analyses from 3 mice. The MW is indicated in kDa for each blot. For all quantifications, values are the mean ± SEM. See also Figure S5.
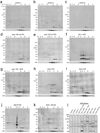
Figure 6
Figure 6. Accumulation of T-sol α-syn oligomers occurs in GD brain
Native SEC followed by SDS-PAGE/western blot of human cortical lysates (T-sol). Radius is in Å (horizontal), apparent MW is in kDa (vertical). Monomeric α-syn elutes at 34Å. (AC) Healthy controls, (D, E) type I non-neuronopathic GD. (F) Atypical Parkinson’s disease (APD). (G) dementia with Lewy bodies (DLB). (H, I) Analysis of cortical material obtained from infants with type II acute neuronopathic GD. (J) Cortical lysates from a 3-yr old child with neuronopathic type III GD. (K) DLB with a heterozygous mutation in GBA1. I) Analysis of the 45 Å-sized fraction with syn303, which preferentially detects pathological oligomeric α-syn. Bands migrating at 18, 44, and 75 kDa were detected with both syn303 and syn211 (arrows). See also Figure S6, Table S2.
Figure 7
Figure 7. Elevated levels of α-syn inhibit the intracellular trafficking of GCase and decrease lysosomal GCase function
A) Inducible H4 cells expressing human wt α-syn were analyzed for post-ER and ER GCase by western blot (n=6, *p<0.01). α-tub was used as a loading control. B) post-ER/ER GCase in cortical neurons expressing human wt, A53T, or Δ71–82 α-syn. α-syn levels were determined by syn211 (human specific) and syn202 (human and mouse). NSE was used as a loading control. C) GCase activity in cortical neurons of P2 and P3 fractions (n=6, *p<0.01, compared to vect). D) Analysis of GCase in cortex of 65–80 yr old controls. Samples 1, 2, 4, 6= ‘high α-syn’; samples 3,5=‘low α-syn.’ Quantification of α-syn protein and post-ER/ER GCase levels is graphed below the blots (*p<0.01). E) GCase western blot of PD brain lysates. α-Tub and CBB were used as loading controls. GCase levels were quantified below (n=3 (control), or 6 (PD), *p=0.02). Bottom, GCase activity in P2 and P3 fractions (n=3–6, *p=0.04). MW for each blot is indicated in kDa. F) Pathogenic positive feedback mechanism of α-syn and GCase depletion in the lysosome. 1) Lysosomal GlcCer accumulation accelerates and stabilizes soluble α-syn oligomers (bold arrow), which eventually convert into amyloid fibrils (thin arrow). 2) Accumulation of α-syn blocks the ER-Golgi trafficking of GCase. 3) Decrease of GCase in the lysosome further amplifies GlcCer accumulation, stabilization of soluble α-syn oligomers, and results in a stronger inhibition of GCase ER-Golgi trafficking with each pathogenic cycle. For all quantifications, values are the mean ± SEM. See also Figure S7 and Tables S3–S6.

Comment in

Similar articles

Cited by

References

    1. Auluck PK, Chan HY, Trojanowski JQ, Lee VM, Bonini NM. Chaperone suppression of alpha-synuclein toxicity in a Drosophila model for Parkinson's disease. Science. 2002;295:865–868. - PubMed
    1. Brady RO, Kanfer J, Shapiro D. The Metabolism of Glucocerebrosides. I. Purification and Properties of a Glucocerebroside-Cleaving Enzyme from Spleen Tissue. J Biol Chem. 1965;240:39–43. - PubMed
    1. Bultron G, Kacena K, Pearson D, Boxer M, Yang R, Sathe S, Pastores G, Mistry PK. The risk of Parkinson's disease in type 1 Gaucher disease. J Inherit Metab Dis. 2010;33:167–173. - PMC - PubMed
    1. Chandra S, Gallardo G, Fernandez-Chacon R, Schluter OM, Sudhof TC. Alpha-synuclein cooperates with CSPalpha in preventing neurodegeneration. Cell. 2005;123:383–396. - PubMed
    1. Conway KA, Harper JD, Lansbury PT. Accelerated in vitro fibril formation by a mutant alpha-synuclein linked to early-onset Parkinson disease. Nat Med. 1998;4:1318–1320. - PubMed

Publication types