Live cell imaging reveals structural associations between the actin and microtubule cytoskeleton in Arabidopsis
- PMID: 21693695
- PMCID: PMC3160026
- DOI: 10.1105/tpc.111.087940
Live cell imaging reveals structural associations between the actin and microtubule cytoskeleton in Arabidopsis
Abstract
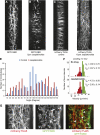
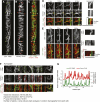
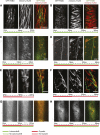
In eukaryotic cells, the actin and microtubule (MT) cytoskeletal networks are dynamic structures that organize intracellular processes and facilitate their rapid reorganization. In plant cells, actin filaments (AFs) and MTs are essential for cell growth and morphogenesis. However, dynamic interactions between these two essential components in live cells have not been explored. Here, we use spinning-disc confocal microscopy to dissect interaction and cooperation between cortical AFs and MTs in Arabidopsis thaliana, utilizing fluorescent reporter constructs for both components. Quantitative analyses revealed altered AF dynamics associated with the positions and orientations of cortical MTs. Reorganization and reassembly of the AF array was dependent on the MTs following drug-induced depolymerization, whereby short AFs initially appeared colocalized with MTs, and displayed motility along MTs. We also observed that light-induced reorganization of MTs occurred in concert with changes in AF behavior. Our results indicate dynamic interaction between the cortical actin and MT cytoskeletons in interphase plant cells.
Figures


Similar articles
-
Reorganization and translocation of the ectoplasmic cytoskeleton in the leech zygote by condensation of cytasters and interactions of dynamic microtubules and actin filaments.Cell Motil Cytoskeleton. 2002 Nov;53(3):214-30. doi: 10.1002/cm.10069. Cell Motil Cytoskeleton. 2002. PMID: 12211103
-
Actin filament dynamics are dominated by rapid growth and severing activity in the Arabidopsis cortical array.J Cell Biol. 2009 Jan 26;184(2):269-80. doi: 10.1083/jcb.200806185. J Cell Biol. 2009. PMID: 19171759 Free PMC article.
-
The Microtubule-Associated Protein Tau Mediates the Organization of Microtubules and Their Dynamic Exploration of Actin-Rich Lamellipodia and Filopodia of Cortical Growth Cones.J Neurosci. 2018 Jan 10;38(2):291-307. doi: 10.1523/JNEUROSCI.2281-17.2017. Epub 2017 Nov 22. J Neurosci. 2018. PMID: 29167405 Free PMC article.
-
Dynamic changes and the role of the cytoskeleton during the cell cycle in higher plant cells.Int Rev Cytol. 2002;214:161-91. doi: 10.1016/s0074-7696(02)14005-8. Int Rev Cytol. 2002. PMID: 11893165 Review.
-
Recent progress in living cell imaging of plant cytoskeleton and vacuole using fluorescent-protein transgenic lines and three-dimensional imaging.Protoplasma. 2007;230(3-4):129-39. doi: 10.1007/s00709-006-0237-4. Epub 2007 Apr 24. Protoplasma. 2007. PMID: 17458628 Review.
Cited by
-
Cytoskeletal organization in isolated plant cells under geometry control.Proc Natl Acad Sci U S A. 2020 Jul 21;117(29):17399-17408. doi: 10.1073/pnas.2003184117. Epub 2020 Jul 8. Proc Natl Acad Sci U S A. 2020. PMID: 32641513 Free PMC article.
-
Spatiotemporal Pattern of Ectopic Cell Divisions Contribute to Mis-Shaped Phenotype of Primary and Lateral Roots of katanin1 Mutant.Front Plant Sci. 2020 Jun 9;11:734. doi: 10.3389/fpls.2020.00734. eCollection 2020. Front Plant Sci. 2020. PMID: 32582258 Free PMC article.
-
Actin-microtubule crosstalk in cell biology.Nat Rev Mol Cell Biol. 2019 Jan;20(1):38-54. doi: 10.1038/s41580-018-0067-1. Nat Rev Mol Cell Biol. 2019. PMID: 30323238 Review.
-
The Actin Cytoskeleton: Functional Arrays for Cytoplasmic Organization and Cell Shape Control.Plant Physiol. 2018 Jan;176(1):106-118. doi: 10.1104/pp.17.01519. Epub 2017 Nov 30. Plant Physiol. 2018. PMID: 29192029 Free PMC article. Review.
-
Microtubules in plants.Arabidopsis Book. 2015 Apr 27;13:e0179. doi: 10.1199/tab.0179. eCollection 2015. Arabidopsis Book. 2015. PMID: 26019693 Free PMC article.
References
-
- Barton D.A., Overall R.L. (2010). Cryofixation rapidly preserves cytoskeletal arrays of leaf epidermal cells revealing microtubule co-alignments between neighbouring cells and adjacent actin and microtubule bundles in the cortex. J. Microsc. 237: 79–88 - PubMed
-
- Baskin T.I., Wilson J.E., Cork A., Williamson R.E. (1994). Morphology and microtubule organization in Arabidopsis roots exposed to oryzalin or taxol. Plant Cell Physiol. 35: 935–942 - PubMed
-
- Basu R., Chang F. (2007). Shaping the actin cytoskeleton using microtubule tips. Curr. Opin. Cell Biol. 19: 88–94 - PubMed
-
- Blancaflor E.B. (2000). Cortical actin filaments potentially interact with cortical microtubules in regulating polarity of cell expansion in primary roots of maize (Zea mays L.). J. Plant Growth Regul. 19: 406–414 - PubMed
Publication types
MeSH terms
Substances
LinkOut - more resources
Full Text Sources

