. 2011 Jun 27;193(7):1257-74.
doi: 10.1083/jcb.201101050. Epub 2011 Jun 20.

Pannexin 3 functions as an ER Ca(2+) channel, hemichannel, and gap junction to promote osteoblast differentiation

Affiliations

Pannexin 3 functions as an ER Ca(2+) channel, hemichannel, and gap junction to promote osteoblast differentiation

Masaki Ishikawa et al. J Cell Biol. .

Abstract

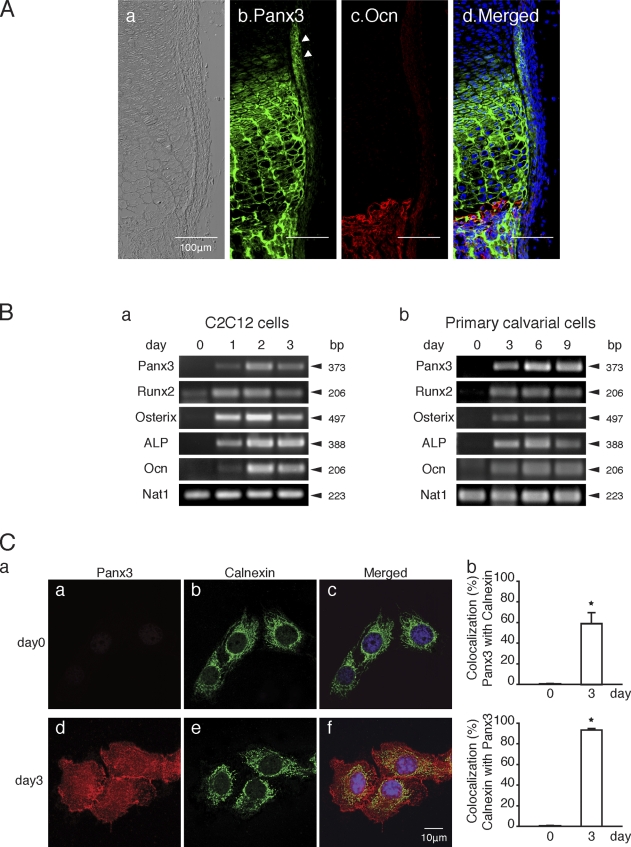
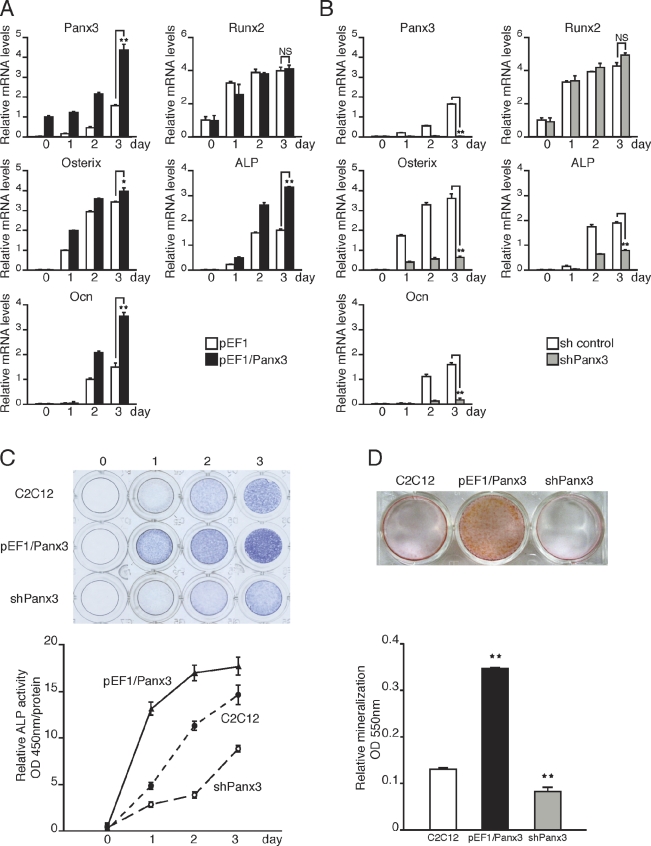
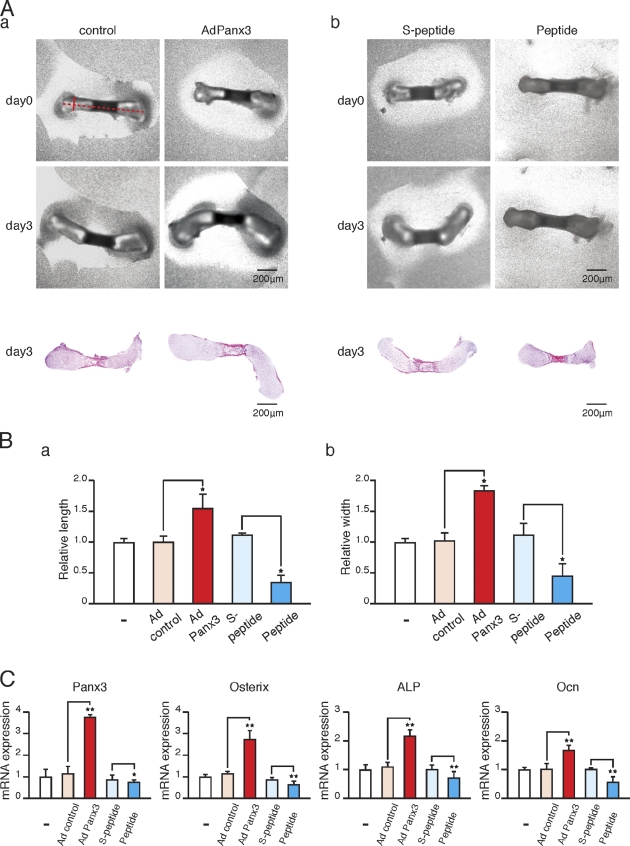
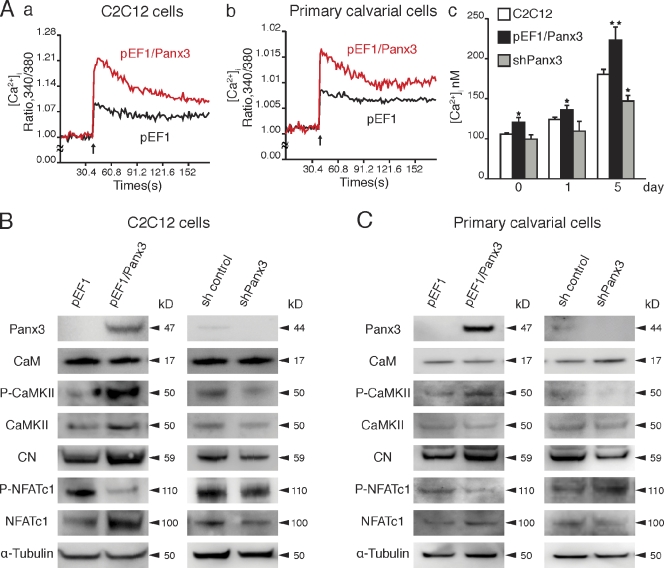
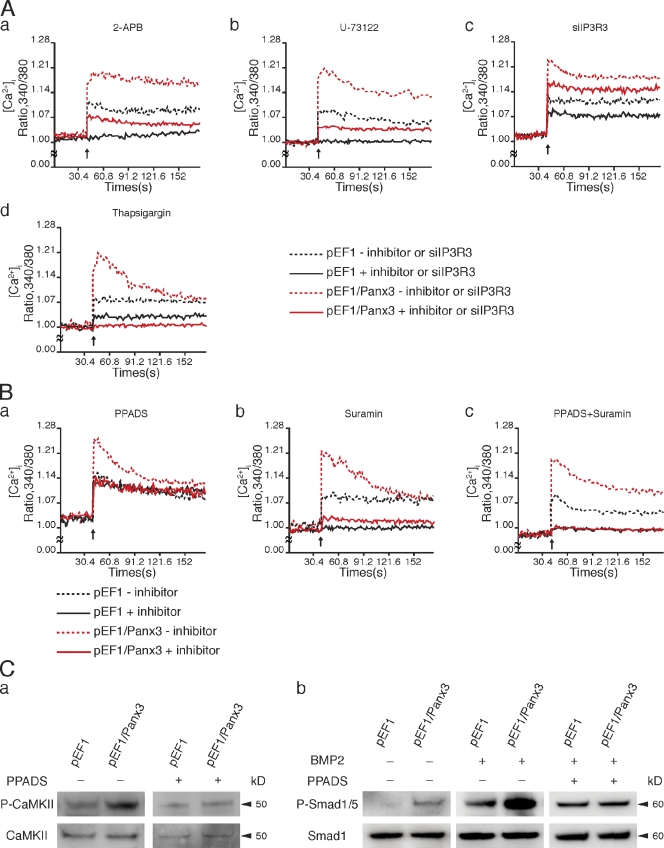
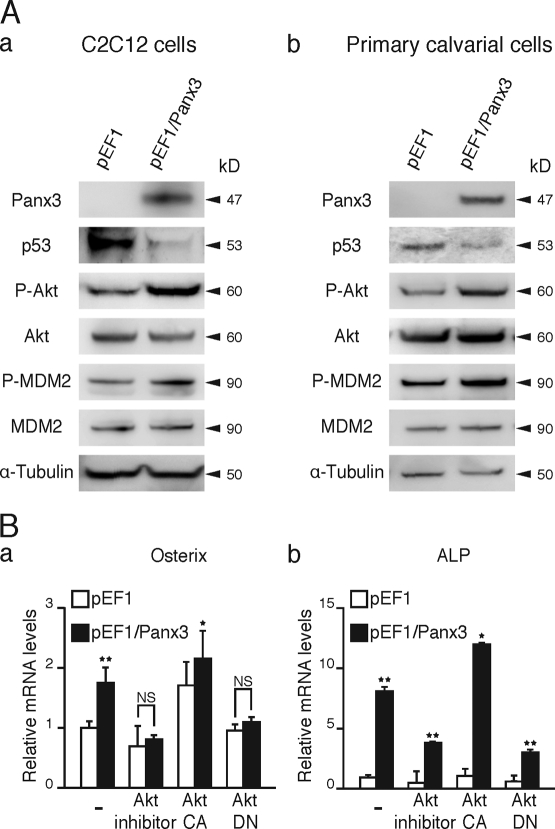
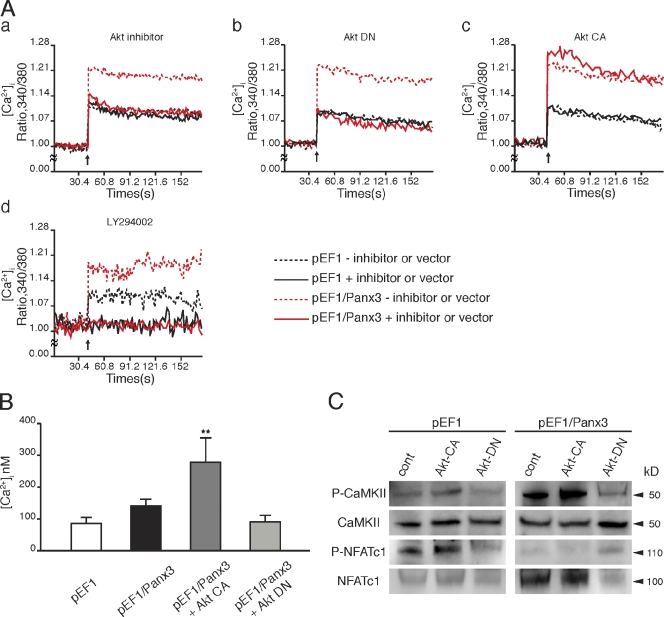
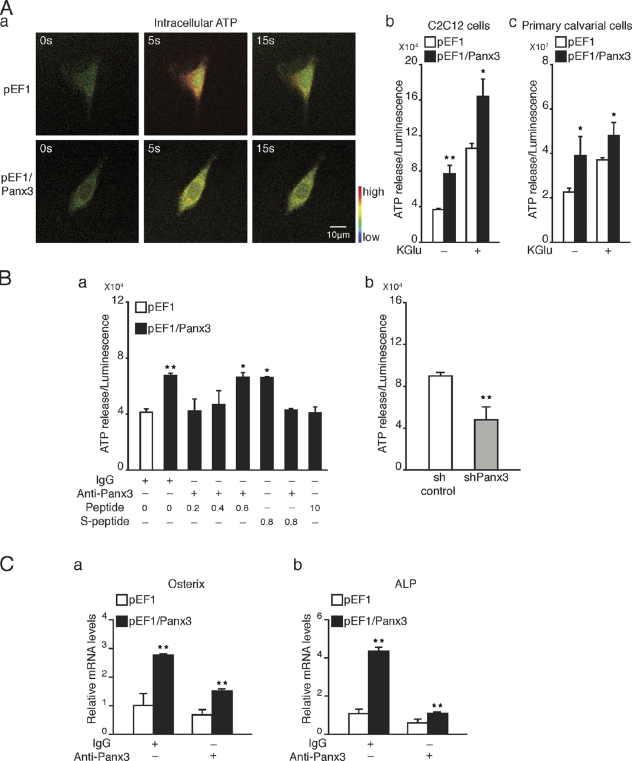
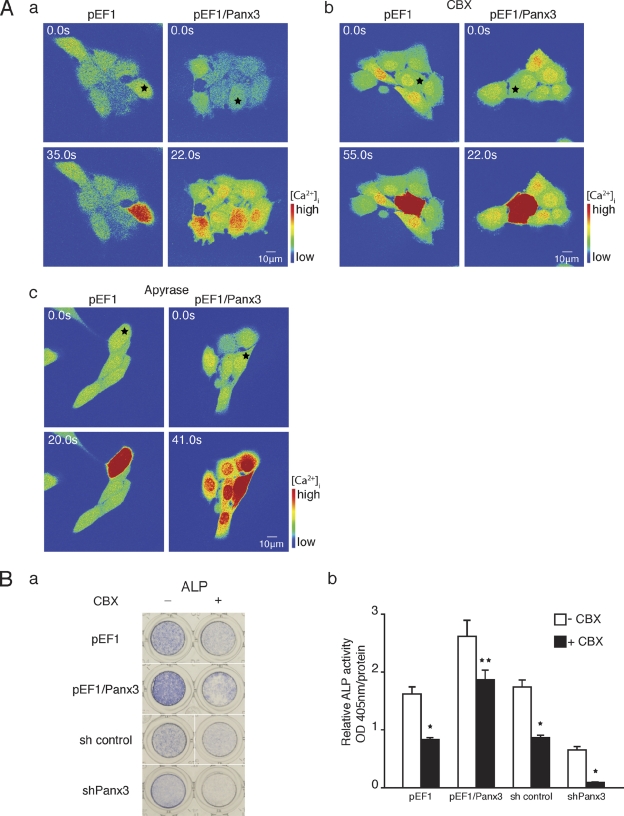
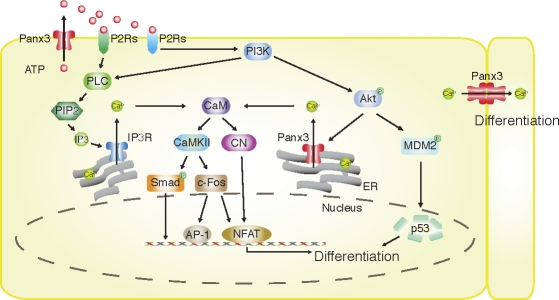
The pannexin proteins represent a new gap junction family. However, the cellular functions of pannexins remain largely unknown. Here, we demonstrate that pannexin 3 (Panx3) promotes differentiation of osteoblasts and ex vivo growth of metatarsals. Panx3 expression was induced during osteogenic differentiation of C2C12 cells and primary calvarial cells, and suppression of this endogenous expression inhibited differentiation. Panx3 functioned as a unique Ca(2+) channel in the endoplasmic reticulum (ER), which was activated by purinergic receptor/phosphoinositide 3-kinase (PI3K)/Akt signaling, followed by activation of calmodulin signaling for differentiation. Panx3 also formed hemichannels that allowed release of ATP into the extracellular space and activation of purinergic receptors with the subsequent activation of PI3K-Akt signaling. Panx3 also formed gap junctions and propagated Ca(2+) waves between cells. Blocking the Panx3 Ca(2+) channel and gap junction activities inhibited osteoblast differentiation. Thus, Panx3 appears to be a new regulator that promotes osteoblast differentiation by functioning as an ER Ca(2+) channel and a hemichannel, and by forming gap junctions.


Figures

Figure 1.
Figure 1.
Expression of Panx3 in growth plates, C2C12 cells, and primary calvarial cells. (A) Immunostaining of newborn mouse growth plates. Image under light microscopy (a), Panx3 (b), Ocn (c), Hoechst nuclear staining (blue), and merged image (d). Arrowheads, perichondrium/periosteum. (B) Semiquantitative RT-PCR. C2C12 cells (a) and primary calvarial cells (b) were cultured with BMP2 and ascorbate, respectively, at day 0. Panx3 was induced during osteoblast differentiation in both cell types. Runx2, osterix, ALP, and Ocn are osteoblast differentiation marker genes. Nat1 was used as a control. (C, a) Cellular localization of endogenous Panx3 in undifferentiated (a–c) and differentiated C2C12 cells (d–f) after 4 d of culture with BMP2. Panx3 (red) was localized in the plasma membrane, cell–cell junctions, and ER membranes in differentiated cells. Calnexin was used as an ER marker. (b) Measurements show a percentage of colocalization between Panx3 with calnexin (top), and calnexin with Panx3 (bottom). *, P < 0.05. Error bars represent the mean ± SD; n = 12.
Figure 2.
Figure 2.
Panx3 promotes osteoblast differentiation. C2C12 cells were transiently transfected with a control pEF1 vector, pEF1/Panx3, a control sh vector, or a Panx3 shRNA vector, and these cells were cultured with BMP2 for various durations, as indicated. Total RNA was extracted each day for 4 d and mRNA levels were analyzed by quantitative RT-PCR. (A) Panx3 overexpression promoted the expression of osteoblast marker genes for osterix, ALP, and Ocn, except that the expression of Runx2 remained the same. (B) shPanx3 suppressed the induction of these genes, except for Runx2. (C) Panx3 overexpression promoted ALP activity, whereas shPanx3 inhibited it. Representative ALP staining (top) and its quantitative data (bottom). C2C12 cells and pEF1/Panx3- and shPanx3-transfected C2C12 cells were cultured with BMP2 for 3 d. (D) Representative Alizarin red S staining (top) and its quantitative data (bottom) of C2C12 and pEF1/panx3- and shPanx3-transfected C2C12 cells cultured with BMP2 for 15 d. **, P < 0.01. Error bars represent the mean ± SD; n = 3.
Figure 3.
Figure 3.
Panx3 promotes the growth of metatarsus ex vivo. (A) Live images of ex vivo metatarsal growth (top) and histology (bottom). (a) Newborn mouse metatarsal bones were cultured and infected with Panx3 adenovirus (AdPanx3) or control adenovirus. (b) Metatarsus cultures were incubated with the Panx3 peptide for 3 d. Metatarsal bone growth was measured by real-time imaging. AdPanx3 promoted metatarsal bone growth (a), whereas the Panx3 peptide inhibited it (b). (B) Relative change in metatarsal length (Ba) or width (Bb) after 3 d in culture compared with day 0. The bone length was measured from edge to edge (A, a, broken red line). The width was measured from side to side (A, a, red line). AdPanx3 promoted the growth of both length and width, whereas Panx3 peptide inhibited both. (C) Quantitative RT-PCR. Metatarsus cultures were incubated for 3 d with AdPanx3 or the Panx3 peptide. AdPanx3 promoted the expression of osteoblast marker genes, osterix, ALP, and Ocn. The Panx3 peptide inhibited this marker gene expression. *, P < 0.05; **, P < 0.01. Error bars represent the mean ± SD; n = 3.
Figure 4.
Figure 4.
Panx3 functions as an ER Ca2+ channel, and activates the CaM and Akt pathways. (A, a and b) Panx3 ER Ca2+ channel. C2C12 cells stably transfected with pEF1 (black) or pEF1/Panx3 (red) expression vectors were analyzed for ATP-stimulated [Ca2+]i in a time course (A, a). Primary calvarial cells were transiently transfected with pEF1 (black) or pEF1/Panx3 (red) expression vectors (A, b). The data shown are representative of at least four different experiments. (A, c) [Ca2+]i levels during differentiation of C2C12 cells. Untransfected and stably transfected cells with pEF1/Panx3 or shPanx3 vectors were cultured with BMP2 at the indicated days. [Ca2+]i levels in pEF1/Panx3-transfected cells were much higher than in C2C12 cells, whereas those in shPanx3 cells were lower. *, P < 0.05; **, P < 0.01. Error bars represent the mean ± SD, n = 3. (B and C) Panx3 activates the CaM/NFATc1 signaling pathways. C2C12 cells or primary calvarial cells were stably and transiently transfected with pEF1 and pEF1/Panx3 vectors, respectively, then incubated for 1 h with BMP2, and the levels of the signal molecules were analyzed by Western blotting. For shPanx3 inhibition experiments, stably transfected C2C12 cells or transiently transfected primary calvarial cells with sh control and shPanx3 RNA were cultured for 1 d in the presence of BMP2.
Figure 5.
Figure 5.
Panx3 ER Ca2+ channel activation and its downstream signaling. C2C12 cells stably transfected with pEF1 or pEF1/Panx3 expression vectors were analyzed for ATP-stimulated [Ca2+]i. Inhibitors were added to the cell culture for 30 min before ATP stimulation. In inhibition to endogenous IP3R3 expression, [Ca2+]i was analyzed after 3 d of transfection of C2C12 cells with siRNA for IP3R3. (A) Panx3 ER Ca2+ channel independent of the IP3R ER Ca2+ channel. 2-APB (IP3R inhibitor; a) or U-73122 (IP3 synthesis inhibitor; b) completely inhibited Ca2+ release from the IP3R ER Ca2+ channel. The Panx3 ER Ca2+ channel was inhibited by 2-APB (a), whereas it was partially inhibited by U-73122 (b). siRNA for IP3R3 inhibited the IP3R3 ER Ca2+ channel, but not the Panx3 ER Ca2+ channel (c). Thapsigargin (SERCA ER Ca2+ pump inhibitor) completely inhibited Ca2+ release from the ER in pEF1/Panx3-transfected cells, whereas it partially inhibited it in pEF1-transfected cells (d). The data shown are representative of at least three different experiments. (B) PPADS inhibited the Panx3 ER Ca2+ channel but not the IP3R ER Ca2+ channel (a). Suramin completely inhibited the IP3R ER Ca2+ channel but partially inhibited the Panx3 ER Ca2+ channel (b). A combination of PPADS and suramin blocked both ER Ca2+ channels (c). Arrows indicate the time of ATP addition. The data shown are representative of at least three different experiments. (C) PPADS inhibition of CaM downstream signaling. Stably transfected C2C12 cells with pEF1 and pEF1/Panx3 vectors were incubated for 1 h with BMP2, with or without PPADS, and levels of phosphorylation of CaMKII (a) and Smad1/5 (b) phosphorylation were analyzed by Western blotting. The left panel in b indicates Smad1/5 phosphorylation levels in cells without BMP2 and PPADS. In the middle and right panels of b, cells were induced by BMP2.
Figure 6.
Figure 6.
Panx3 activates the Akt pathway. (A, a and b) Panx3 activates Akt signaling. Stably transfected C2C12 cells or transiently transfected primary calvarial cells with pEF1 and pEF1/Panx3 vectors were incubated for 1 h with BMP2, and levels of signal molecules were analyzed by Western blotting. Panx3 expression increased phosphorylation of Akt and MDM2 and promoted p53 degradation. (B) Akt inhibition reduced Panx3-promoted expression of osterix (a) and ALP expression (b). The transfected cells were cultured with BMP2 for 3 d, and the expression of osterix and ALP was analyzed by real-time PCR. The Akt inhibitor and Akt DN inhibited the expression of Panx3-mediated induction of these genes, whereas Akt CA increased the expression levels in control and Panx3-overexpressing cells. *, P < 0.05; **, P < 0.01. Error bars indicate the mean ± SD; n = 3.
Figure 7.
Figure 7.
Activation of Panx3 ER Ca2+ channel by PI3K–Akt signaling. (A) pEF1- or pEF1/Panx3-transfected C2C12 cells were incubated with the Akt inhibitor (a), or transfected with the dominant-negative Akt (Akt DN; b), the activated Akt (Akt CA) vector (c), or LY294002 (PI3K inhibitor; d). [Ca2+]i was measured by the fluorescence intensity ratio of Fura-2 (F340nm/F380nm) in each condition. The Akt inhibitor blocked the Panx3 ER Ca2+ channel (a). Akt DN inhibited the Panx3 ER Ca2+ channel, not the IP3R ER channel (b). Akt CA promoted the Panx3 ER Ca2+ channel, not the IP3R ER channel (c). LY294002 inhibited Ca2+ release from both Panx3 and IP3R ER Ca2+ channels (d). Arrows indicate the time of ATP addition. The data shown are representative of at least three different experiments. (B) The [Ca2+]i level was increased by Akt activation. The basal levels of [Ca2+]i in Panx3-overexpressing C2C12 (pEF1/Panx3) cells are higher than in control vector–transfected (pEF1) cells. Akt CA increased [Ca2+]i in pEF1/Panx3 cells, whereas Akt DN reduced [Ca2+]i to similar levels in control cells. (C) The transfected cells were induced by BMP2 for 1 h, and phosphorylation of CaMKII and NFATc1 was analyzed by Western blotting. Akt increased CaMKII and NFATc1 phosphorylation levels in control cells, and Panx3 overexpression further enhanced its activation. Akt DN inhibited these activations to the levels in control cells. *, P < 0.05; **, P < 0.01. Error bars indicate the mean ± SD; n = 3.
Figure 8.
Figure 8.
Panx3 hemichannel releases intracellular ATP and promotes differentiation. (A) Imaging of intracellular ATP levels in pEF1- or pEF1/Panx3-transfected C2C12 cells. Cells were incubated with the caged luciferin, and then exposed to a flash of UV light for photolysis to convert active luciferin. Fluorescence excitation images (red) caused by luciferin–ATP interactions at 5 s and 15 s after a UV flash were shown. Higher red fluorescence images were observed in control pEF1-transfected cells compared with Panx3-overexpressing cells, which indicates that Panx3 overexpression reduced intracellular ATP levels. (A, b and c) Measurement of ATP release. The transfected C2C12 cells or primary calvarial cells were treated with or without KGlu for 2 min, and then ATP released into the media was measured. (B) Inhibition of ATP release. The transfected cells were incubated with Panx3 antibody or Panx3 peptide for 30 min, and ATP release was measured. The Panx3 antibody (1.5 µg/ml) inhibited ATP release in pEF1/Panx3-transfected cells (a). This inhibition was blocked by various concentrations of the Panx3 peptide. The Panx3 peptide also inhibited the ATP release (a). Control sh- or shPanx3-transfected cells were cultured with BMP2 for 2 d, and ATP release was measured. ATP release was reduced in shPanx3-transfected cells compared with control sh-transfected cells (b). (C) Inhibition of osterix (a) and ALP (b) expression by the anti-Panx3 antibody. *, P < 0.05; **, P < 0.01. Error bars represent the mean ± SD; n = 3.
Figure 9.
Figure 9.
Panx3 functions as a gap junction. (A) Real-time imaging of Ca2+ wave propagation. The Ca2+ wave was measured in cells loaded with Fluo-4 and NP-EGTA (caged Ca2+) by starting photolysis of NP-EGTA in a single cell using a flash of UV light. (a) pEF1/Panx3-transfected cells, but not pEF1-transfected cells, propagated Ca2+ waves to neighboring cells. (b) Inhibition of the Ca2+ wave propagation by CBX (gap junction inhibitor). (c) Apyrase, ATP receptor antagonist, did not inhibit Ca2+ propagation in pEF1/Panx3-transfected cells. (B) CBX inhibited C2C12 cell differentiation. (a) ALP staining. (b) Quantitative data from the ALP staining. CBX inhibited osteoblast differentiation in pEF1/Panx3-transfected cells (a and b). *, P < 0.05; **, P < 0.01. Error bars represent the mean ± SD; n = 3.
Figure 10.
Figure 10.
Panx3 pathways in osteoblast differentiation. The Panx3 hemichannel releases intracellular ATP. The released ATP binds to purinoreceptors (P2Rs) in its own cell and/or neighboring cells, and activates the PI3K–Akt pathway. Akt then activates the Panx3 ER Ca2+ channel to increase [Ca2+]i levels, which leads to activation of the CaM–CaMKII pathway. The ATP also activates the PLC–PIP2–IP3R ER Ca2+ channel pathway, which is distinct from that of the Panx3 ER Ca2+ channel. The Akt activation also phosphorylates MDM2, which induces degradation of p53, an inhibitor for osteogenic differentiation, and promotes differentiation. CaM also activates CN, which dephosphorylates inactive phosphorylated NFAT in cytosol. Dephosphorylated NFATc1 enters the nucleus and binds to the promoter regions of differentiation genes such as osterix and ALP. Activated CaMKII also increases c-fos and NFAT expression, and activation of Ap-1 and Smad1/5. Panx3 gap junction activity promotes Ca2+ wave propagation between adjacent cells for differentiation.

Similar articles

Cited by

References

    1. Baranova A., Ivanov D., Petrash N., Pestova A., Skoblov M., Kelmanson I., Shagin D., Nazarenko S., Geraymovych E., Litvin O., et al. 2004. The mammalian pannexin family is homologous to the invertebrate innexin gap junction proteins. Genomics. 83:706–716 10.1016/j.ygeno.2003.09.025 - DOI - PubMed
    1. Barbe M.T., Monyer H., Bruzzone R. 2006. Cell-cell communication beyond connexins: the pannexin channels. Physiology (Bethesda). 21:103–114 - PubMed
    1. Beals C.R., Clipstone N.A., Ho S.N., Crabtree G.R. 1997. Nuclear localization of NF-ATc by a calcineurin-dependent, cyclosporin-sensitive intramolecular interaction. Genes Dev. 11:824–834 10.1101/gad.11.7.824 - DOI - PubMed
    1. Bennett M.V., Verselis V.K. 1992. Biophysics of gap junctions. Semin. Cell Biol. 3:29–47 10.1016/S1043-4682(10)80006-6 - DOI - PubMed
    1. Berridge M.J., Lipp P., Bootman M.D. 2000a. Signal transduction. The calcium entry pas de deux. Science. 287:1604–1605 10.1126/science.287.5458.1604 - DOI - PubMed

Publication types