. 2011 Sep;122(3):293-311.
doi: 10.1007/s00401-011-0834-y. Epub 2011 Jun 19.

Vascular β-amyloid and early astrocyte alterations impair cerebrovascular function and cerebral metabolism in transgenic arcAβ mice

Affiliations

Vascular β-amyloid and early astrocyte alterations impair cerebrovascular function and cerebral metabolism in transgenic arcAβ mice

Mario Merlini et al. Acta Neuropathol. 2011 Sep.

Abstract

Cerebrovascular lesions related to congophilic amyloid angiopathy (CAA) often accompany deposition of β-amyloid (Aβ) in Alzheimer's disease (AD), leading to disturbed cerebral blood flow and cognitive dysfunction, posing the question how cerebrovascular pathology contributes to the pathology of AD. To address this question, we characterised the morphology, biochemistry and functionality of brain blood vessels in transgenic arctic β-amyloid (arcAβ) mice expressing human amyloid precursor protein (APP) with both the familial AD-causing Swedish and Arctic mutations; these mice are characterised by strong CAA pathology. Mice were analysed at early, mid and late-stage pathology. Expression of the glucose transporter GLUT1 at the blood-brain barrier (BBB) was significantly decreased and paralleled by impaired in vivo blood-to-brain glucose transport and reduced cerebral lactate release during neuronal activation from mid-stage pathology onwards. Reductions in astrocytic GLUT1 and lactate transporters, as well as retraction of astrocyte endfeet and swelling consistent with neurovascular uncoupling, preceded wide-spread β-amyloid plaque pathology. We show that CAA at later disease stages is accompanied by severe morphological alterations of brain blood vessels including stenoses, BBB leakages and the loss of vascular smooth muscle cells (SMCs). Together, our data establish that cerebrovascular and astrocytic pathology are paralleled by impaired cerebral metabolism in arcAβ mice, and that astrocyte alterations occur already at premature stages of pathology, suggesting that astrocyte dysfunction can contribute to early behavioural and cognitive impairments seen in these mice.


Figures

Fig. 1
Fig. 1
Endothelial GLUT1 but not neuronal GLUT3 protein expression and basal glucose levels are decreased in the TG arcAβ mouse brain from mid-stage pathology onwards. a Immunohistochemical staining of a representative cortical brain section showing GLUT1 protein expression on CAA and non-CAA blood vessels in a mid-stage TG arcAβ mouse. Reduced GLUT1 immuno-staining (arrow) on a CAA-vessel (stained with antibody 6E10, arrow) can be seen. However, CD31—a marker for endothelial cells—was not affected and eventual impaired staining for GLUT1 due to antigen-masking by CAA (arrow) could be ruled out. b Immunohistochemical staining of a representative cortical brain section of a mid-stage arcAβ mouse shows that in areas with dense presence of diffuse Aβ plaques also non-CAA vessels had reduced GLUT1 protein expression, whereas CD31 staining was preserved on these vessels (arrows). CD31 was found to be continuously expressed on the whole length of the vessels in contrast to GLUT1 which showed interruptions in the staining pattern (outlined section). c Statistical analysis of CD31 and GLUT1 expression on CAA-vessels in mid-stage arcAβ mice. Immunostaining for GLUT1 was significantly lower on these CAA-vessels as compared to the CD31 staining. Student’s t test, p = 0.0004 (n = 35 CAA vessels). d Western blots of hippocampus and cortex of mid-stage TG arcAβ mice and NTG littermates demonstrating that the endothelial GLUT1 protein expression (55 kDa) was reduced in TG animals as compared to their NTG littermates. No differences were found in the levels of the neuronal GLUT3 protein. Scale bar a 100 μm; b 300 μm
Fig. 2
Fig. 2
Blood-to-brain glucose uptake and astrocytic lactate release upon neuronal stimulation are impaired in TG arcAβ mouse brain starting at mid-stage pathology. a Lower baseline glucose concentration profile in hippocampal ECF microdialysate of mid-stage TG arcAβ mice as compared to their NTG littermates. Microdialysis samples were taken in 30-min intervals over 10 h. On average baseline hippocampal glucose was about 30% lower in TG animals as compared to their NTG littermates. Note the higher degree of intra-individual deviation in the TG animals, possibly due to the heterogeneity of CAA and/or Aβ plaque load in this group. b No differences were found in plasma glucose levels between TG arcAβ mice and their NTG littermates. Blood was withdrawn from the tail vein of the mice after an 8-h period of fasting. Mean plasma glucose concentration for both TG and NTG animals was around 3.5 mmol/l. c Graph illustrating impaired rise in glucose in hippocampal ECF of TG arcAβ mice upon systemic administration of glucose alone (sample 5, single arrow) and in combination with neuronal stimulation using potassium chloride (KCl) (sample 24, double arrows). Intraperitoneal injection of 250 mM d-glucose in TG arcAβ mice and their NTG littermates (sample 5, single arrow) after 12 h of fasting led to a sharp increase in hippocampal ECF glucose in NTG animals, whereas the TG animals did not demonstrate such rise in glucose levels. However, intraperitoneal injection of 250 mM d-glucose in combination with neuronal stimulation by retrodialysis of 120 mM KCl (sample 24, double arrows) into the hippocampal ECF both TG and NTG animals showed an increase in glucose. d Impaired increase in lactate concentrations in TG animals upon neuronal stimulation. No difference in basal lactate levels was found between TG animals and their NTG littermates (samples 1–23). Lactate was measured in the same microdialysate samples as collected for glucose uptake analyses (Fig. 2a). Note that intraperitoneal administration of glucose did not have an effect on lactate concentrations (sample 5, single arrow). Retrodialysis of 120 mM KCl (sample 24, double arrows) led to a fast and steep increase in lactate levels in the microdialysate of NTG animals, a response which was not found in the TG mice. The TG animals showed slower and smaller rise in lactate and a delay in the time to reach baseline concentrations
Fig. 3
Fig. 3
Expression of the astrocytic glucose and lactate transporter involved in cerebral metabolism and neuronal functioning is reduced in astrocytes cultured from mid-stage TG arcAβ mouse brain with concomitant decreased lactate release. a GLUT1 and MCT1 (astrocytic lactate transporter) were down-regulated in whole cell lysate preparations of astrocyte cultures originating from mid-stage TG arcAβ mice. Staining for β actin served as loading control for all samples. b Astrocytic lactate release in media of the same astrocyte cultures originating from mid-stage TG and NTG arcAβ mice. A decreased lactate concentration was found in culture media of TG astrocytes as compared to astrocytes from NTG littermate brains
Fig. 4
Fig. 4
Intensive astrogliosis with concomitant laminin over-expression is already present in the early-stage TG arcAβ mouse brain. a Representative cortical brain section of an early-stage TG arcAβ mouse triple-stained for GFAP, laminin and Aβ/APP. Only few diffuse Aβ plaques and little vascular Aβ deposits were seen at this age. However, the presence of astrogliosis (GFAP staining) around some incoming leptomeningeal vessels and arterioles (a, arrows) and small vessels (a, asterisks) in the cortex was already detected at this age with a concomitant increased immunopositivity for laminin. b A ×20 of a representative cortical brain section of an early-stage TG arcAβ mouse triple-stained for GFAP, laminin and Aβ/APP. Astrocyte (GFAP) and laminin staining showed expression and/or secretion of laminin in the astrocytic dendrites (arrows) and surrounding the astrocytes (asterisk). Western blots showing a higher amount of laminin in the media of ex vivo astrocyte cultures from early-stage (c) and mid-stage (d) TG arcAβ mice as compared to that of astrocytes from their NTG littermates. Scale bar a 300 μm; b 30 μm. Hue settings of fluorescence for Aβ were altered for more contrast effect explaining the purple colour
Fig. 5
Fig. 5
Diffuse and vascular Aβ deposits induce astrocyte endfeet retraction and swelling in TG arcAβ mice, starting at early-stage pathology. a Representative confocal microscopy images of cortical brain sections of an early-stage TG arcAβ mouse triple-stained for GFAP, laminin and Aβ/APP. At this age, TG arcAβ mice have only few diffuse Aβ plaques and very little CAA but the structural appearance of these Aβ deposits is similar to that in mid-stage and late-stage animals, albeit less dense and restricted in size. Astrocytes (GFAP) surrounding these plaques show swollen endfeet (a, arrows and asterisk) and loss of endfeet contact at CAA-affected vessels (laminin was used as vessel marker). b Arrows in sections show close endfeet—vessel interactions at a non-CAA-affected vessel in a late-stage TG arcAβ mouse brain. The same endfeet retractions and swellings as can be seen in a were observed for astrocytes within and surrounding diffuse Aβ plaques (b, asterisk). Scale bar a 30 μm; b 150 μm. Hue settings of fluorescence for Aβ were altered for more contrast effect explaining the blue colour
Fig. 6
Fig. 6
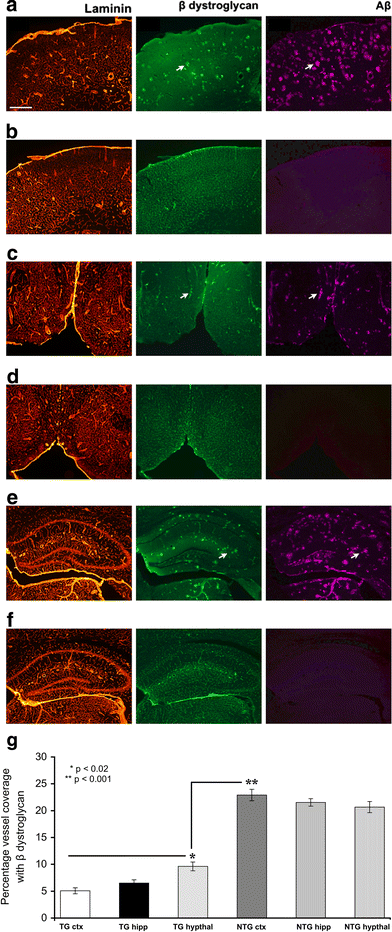
Astrocytic β dystroglycan expression is significantly decreased in late-stage TG arcAβ mouse brain and paralleled by IgG extravasation. Representative images of late-stage TG (a, c, e) and arcAβ NTG littermate (b, d, f) mice showing decreased expression of the astrocyte endfeet protein β dystroglycan in TG arcAβ mouse brain as compared to their NTG littermates. Loss of β dystroglycan immunoreactivity was most pronounced in the cortex (a) and hippocampus (e) of TG animals. This reduced expression was paralleled by the presence of cerebral extravasation of endogenous IgG around diffuse Aβ plaques (a, e, arrows). Areas of the brain (hypothalamic region) where no mouse IgG could be observed did show less pronounced loss of β dystroglycan expression (c). These areas were also not affected by diffuse Aβ plaques but rather by CAA. Scale bar a 300 μm. Presence of mouse IgG was detected by the same secondary anti-mouse antibody (FITC-tagged donkey anti-mouse IgG) used to visualise primary anti-β dystroglycan antibody which was raised in mouse, explaining the presence of both β dystroglycan and endogenous mouse IgG on the same brain sections. g Significant loss of β dystroglycan expression on blood vessels in cortex (ctx), hippocampus (hipp) and hypothalamic region (hypthal) of late-stage TG arcAβ mice compared to NTG littermates. The hypothalamic region of TG arcAβ mice showed significantly more β dystroglycan expression as compared to cortex and hippocampus (p < 0.02) but was still significantly less than in NTG littermates (p < 0.001). β dystroglycan immunoreactivity was calculated by measuring staining intensity using ImageJ software. Student’s t test, n = respective brain areas of 12 mice (6 TG and 6 NTG), three sections/brain area/mouse. Hue settings of fluorescence for Aβ were altered for more contrast effect explaining the purple colour
Fig. 7
Fig. 7
Morphological alterations of the cerebrovasculature in late-stage TG arcAβ mice. Scanning electron microscopy (SEM) of late-stage arcAβ NTG littermates showed clear and regular endothelial cell imprints on arterial vessel walls (a, arrow) and a smooth appearance of the vessel wall. In contrast, late-stage TG arcAβ mice presented a tree bark-like vessel wall and degenerated, often absent endothelial cell imprints (b, arrow). Furthermore, extensive stenoses and bulging of the vessel wall were observed both on arteries and arterioles (b, asterisks and inset). Ball-shaped leakages of the perfusion resin were found on arteries, arterioles and capillaries of the TG arcAβ mice (c, arrows). Loose vessel ends were observed as well (c, asterisk). Whereas the NTG littermates showed a dense and constant vascular bed, the density of the vascular bed in the TG animals was reduced showing numerous gaps, especially in the area of the temporal lobe (d, arrows). Scale bar a 100 μm; b and c 50 μm; d 1 mm
Fig. 8
Fig. 8
Leakages of the cerebrovasculature and cerebral hypoperfusion in late-stage TG arcAβ mice. Brains of littermates of the TG and arcAβ NTG mice used for SEM (Fig. 7) were processed for histological purposes after perfusion with vascular casting resin. Perfusion of the cerebrovasculature with the vascular casting resin showed adequate penetration of arteries and smaller vessels (a, frame). TG littermates showed casting resin leakages similar to those observed with SEM (Fig. 7d) (b, asterisks). Perfusion of the cerebrovasculature with casting resin was, in contrast to the NTG littermates (a, frame), significantly impaired in the cortex showing areas lacking fluorescent casting resin and hence resin-negative vessels (b, frame and c). An eventual hypoperfusion due to reduced vascular density was excluded by the finding of GLUT1-positive endothelium in the non-perfused brain areas (b, frame and d). Scale bar a 150 μm. Hue settings of fluorescence for Aβ were altered for more contrast effect explaining the purple colour
Fig. 9
Fig. 9
In vivo leakages of the cerebrovasculature in late-stage TG arcAβ mice are not paralleled by haemorrhages, suggesting small BBB disruptions. a Intraperitoneal injection of late-stage TG mice and their arcAβ NTG littermates with Trypan Blue showed extravasations of Trypan blue mainly around small vessels in the TG animals (asterisks). Bigger arterioles (a, plus sign) and arteries (a, arrow) were found to accumulate Trypan Blue within the vessel wall. Both small vessel extravasation and arterial accumulation of Trypan Blue within the vessel wall was only seen for vessels affected by CAA. Scale bar a 150 μm. Hue settings of fluorescence for Trypan Blue were altered for more contrast effect explaining the blue colour. (b) Thioflavin S staining (green-yellow) combined with Prussian Blue staining (dark blue, asterisk) showed CAA-related presence of haemorrhages. Scale bar b 30 μm. The number of haemorrhages was significantly lower than Trypan Blue extravasations (c) and not chronically paralleled by vascular casting resin protrusions (d). Scale bar d 150 μm
Fig. 10
Fig. 10
Vascular basement membrane abnormalities in mid and late-stage TG arcAβ mice. Constrictions/stenoses (a, plus signs) and localised thickening of the vessel walls (a, asterisks) were abundantly seen on CAA-laden vessels in brains of late-stage TG arcAβ mice. These basement membrane irregularities due to laminin over-expression (a) were confined to those parts of the cerebral vessels that were affected by CAA; all other parts showed normal laminin expression and smooth vessel wall appearance (a, arrows). Severe CAA in late-stage TG arcAβ mice (b) caused both intense and significant increase in laminin immunopositivity and rupture of the vascular basement membrane laminin (b, arrow; c and d). In addition, dust-like laminin particles could be observed surrounding the affected vessel (b, asterisk). Cerebral vessels of arcAβ NTG littermates lacked CAA and vascular basement membranes showed typical laminin immunopositivity (b, last two image sets). Scale bar a 150 μm; b 30 μm. Hue settings of fluorescence for Aβ were altered for more contrast effect explaining the blue colour
Fig. 11
Fig. 11
Vascular smooth muscle cells are degenerated and severely affected in CAA-laden cerebral vessels in late-stage TG arcAβ mice. CAA-laden arteries and arterioles in late-stage TG arcAβ mice showed a characteristic thickening of the laminin basement membrane (a, upper arrows) and dust-like laminin particles were regularly observed (a, lower arrow). Vascular SMC layers were severely degenerated or completely absent (a, asterisk and arrows; c). In contrast, NTG littermates were found to have a typical laminin basement membrane thickness (b) and an intact, uninterrupted vascular SMC stratum (b, arrow and asterisk). Plus signs in a show presence of mouse IgG which was detected by the same secondary anti-mouse antibody (FITC-tagged donkey anti-mouse IgG) used to visualise primary anti-smooth muscle actin antibody which was raised in mouse, explaining the presence of both smooth muscle cell and endogenous mouse IgG on the same brain sections. Scale bar a 150 μm

Similar articles

Cited by

References

    1. Abbott NJ, Rönnbäck L, Hansson E. Astrocyte-endothelial interactions at the blood–brain barrier. Nat Rev Neurosci. 2006;7:41–53. doi: 10.1038/nrn1824. - DOI - PubMed
    1. Agrawal S, Anderson P, Durbeej M, et al. Dystroglycan is selectively cleaved at the parenchymal basement membrane at sites of leukocyte extravasation in experimental autoimmune encephalomyelitis. J Exp Med. 2006;203:1007–1019. doi: 10.1084/jem.20051342. - DOI - PMC - PubMed
    1. Allaman I, Bélanger M, Magistretti PJ. Astrocyte-neuron metabolic relationships: for better and for worse. Trends Neurosci. 2011;34:76–87. doi: 10.1016/j.tins.2010.12.001. - DOI - PubMed
    1. Bell RD, Zlokovic BV. Neurovascular mechanisms and blood–brain barrier disorder in Alzheimer’s disease. Acta Neuropathol. 2009;118:103–113. doi: 10.1007/s00401-009-0522-3. - DOI - PMC - PubMed
    1. Bourasset F, Ouellet M, Tremblay C, et al. Reduction of the cerebrovascular volume in a transgenic mouse model of Alzheimer’s disease. Neuropharmacology. 2009;56:808–813. doi: 10.1016/j.neuropharm.2009.01.006. - DOI - PubMed

Publication types

MeSH terms

Supplementary concepts

LinkOut - more resources