

Analysis of tumor environmental response and oncogenic pathway activation identifies distinct basal and luminal features in HER2-related breast tumor subtypes
- PMID: 21672245
- PMCID: PMC3218951
- DOI: 10.1186/bcr2899
Analysis of tumor environmental response and oncogenic pathway activation identifies distinct basal and luminal features in HER2-related breast tumor subtypes
Abstract
Introduction: Breast cancer heterogeneity occurs as a consequence of the dysregulation of numerous oncogenic pathways as well as many non-genetic factors, including tumor microenvironmental stresses such as hypoxia, lactic acidosis, and glucose deprivation. Although the importance of these non-genetic factors is well recognized, it is not clear how to integrate these factors within the genetic framework of cancer as the next logical step in understanding tumor heterogeneity.
Methods: We report here the development of a series of gene expression signatures to measure the influences of microenvironmental stresses. The pathway activities of hypoxia, lactic acidosis, acidosis and glucose deprivation were investigated in a collection of 1,143 breast tumors, which have been separated into 17 breast tumor subgroups defined by their distinct patterns of oncogenic pathways. A validation dataset comprised of 547 breast tumors was also used to confirm the major findings, and representative breast cancer cell lines were utilized to validate in silico results and mechanistic studies.
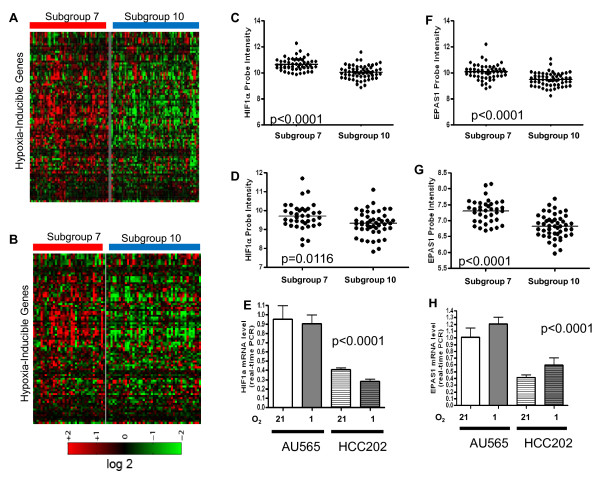
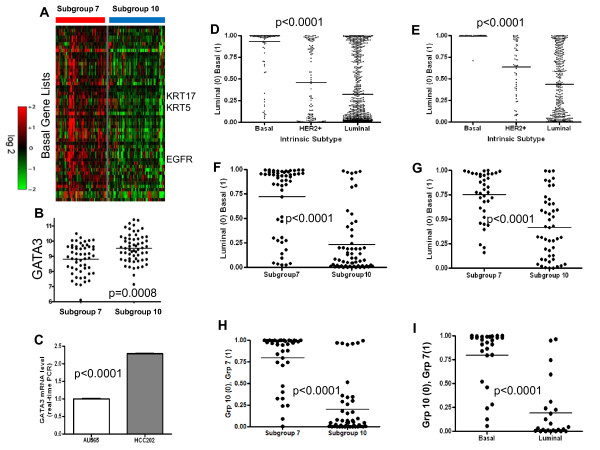
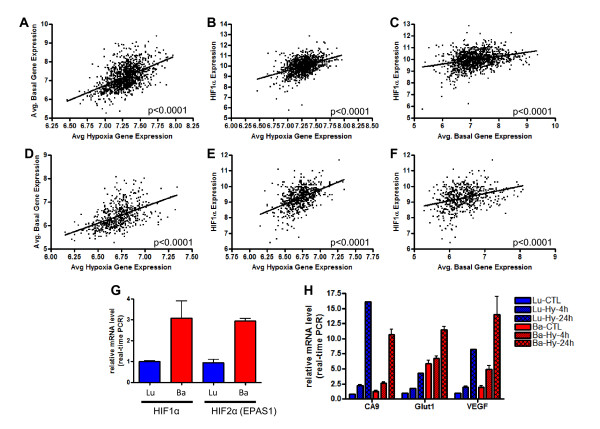
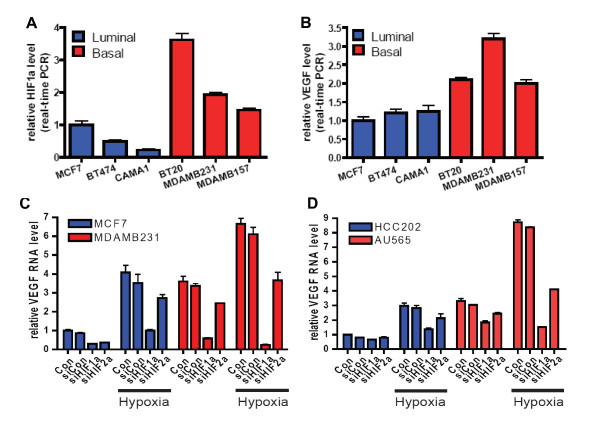
Results: Through the integrative pathway analysis of microenvironmental stresses and oncogenic events in breast tumors, we identified many known and novel correlations between these two sources of tumor heterogeneity. Focusing on differences between two human epidermal growth factor receptor 2 (HER2)-related subgroups, previously identified based on patterns of oncogenic pathway activity, we determined that these subgroups differ with regards to tumor microenvironmental signatures, including hypoxia. We further demonstrate that each of these subgroups have features consistent with basal and luminal breast tumors including patterns of oncogenic signaling pathways, expression of subtype specific genes, and cellular mechanisms that regulate the hypoxia response. Importantly, we also demonstrate that the correlated pattern of hypoxia-related gene expression and basal-associated gene expression are consistent across HER2-related tumors whether we analyze the tumors as a function of our pathway-based classification scheme, using the intrinsic gene list (ERBB2+), or based on HER2 IHC status. Our results demonstrate a cell lineage-specific phenomenon in which basal-like tumors, HER2-related tumors with high hypoxia, as well as normal basal epithelial cells express increased mRNA levels of HIF-1α compared to luminal types and silencing of HIF-1α results in decreased expression of hypoxia-induced genes.
Conclusions: This study demonstrates differences in microenvironmental conditions in HER2-related subgroups defined by distinct oncogenic pathway activities, and provides a mechanistic explanation for differences in the observed hypoxia response between these subgroups. Collectively, these data demonstrate the potential of a pathway-based classification strategy as a framework to integrate genetic and non-genetic factors to investigate the basis of tumor heterogeneity.
Figures


Similar articles
-
HER2 regulates HIF-2α and drives an increased hypoxic response in breast cancer.Breast Cancer Res. 2019 Jan 22;21(1):10. doi: 10.1186/s13058-019-1097-0. Breast Cancer Res. 2019. PMID: 30670058 Free PMC article.
-
Hypoxia/HIF1α induces lapatinib resistance in ERBB2-positive breast cancer cells via regulation of DUSP2.Oncotarget. 2015 Feb 10;6(4):1967-80. doi: 10.18632/oncotarget.2806. Oncotarget. 2015. PMID: 25596742 Free PMC article.
-
PAM50 breast cancer subtyping by RT-qPCR and concordance with standard clinical molecular markers.BMC Med Genomics. 2012 Oct 4;5:44. doi: 10.1186/1755-8794-5-44. BMC Med Genomics. 2012. PMID: 23035882 Free PMC article.
-
Crosstalk between Notch, HIF-1α and GPER in Breast Cancer EMT.Int J Mol Sci. 2018 Jul 10;19(7):2011. doi: 10.3390/ijms19072011. Int J Mol Sci. 2018. PMID: 29996493 Free PMC article. Review.
-
When tumor suppressor TGFβ meets the HER2 (ERBB2) oncogene.J Mammary Gland Biol Neoplasia. 2011 Jun;16(2):81-8. doi: 10.1007/s10911-011-9206-4. Epub 2011 Apr 6. J Mammary Gland Biol Neoplasia. 2011. PMID: 21590373 Free PMC article. Review.
Cited by
-
Recent Advances in Integrative Multi-Omics Research in Breast and Ovarian Cancer.J Pers Med. 2021 Feb 19;11(2):149. doi: 10.3390/jpm11020149. J Pers Med. 2021. PMID: 33669749 Free PMC article. Review.
-
Taxol Induces Brk-dependent Prosurvival Phenotypes in TNBC Cells through an AhR/GR/HIF-driven Signaling Axis.Mol Cancer Res. 2018 Nov;16(11):1761-1772. doi: 10.1158/1541-7786.MCR-18-0410. Epub 2018 Jul 10. Mol Cancer Res. 2018. PMID: 29991529 Free PMC article.
-
Cystine addiction of triple-negative breast cancer associated with EMT augmented death signaling.Oncogene. 2017 Jul 27;36(30):4235-4242. doi: 10.1038/onc.2016.394. Epub 2016 Nov 21. Oncogene. 2017. PMID: 27869167 Free PMC article.
-
Granulocyte Colony Stimulating Factor Expression in Breast Cancer and Its Association with Carbonic Anhydrase IX and Immune Checkpoints.Cancers (Basel). 2021 Mar 1;13(5):1022. doi: 10.3390/cancers13051022. Cancers (Basel). 2021. PMID: 33804486 Free PMC article.
-
Notch-based gene signature for predicting the response to neoadjuvant chemotherapy in triple-negative breast cancer.J Transl Med. 2023 Nov 15;21(1):811. doi: 10.1186/s12967-023-04713-3. J Transl Med. 2023. PMID: 37964363 Free PMC article.
References
-
- Perou CM, Sorlie T, Eisen MB, van de Rijn M, Jeffrey SS, Rees CA, Pollack JR, Ross DT, Johnsen H, Akslen LA, Fluge O, Pergamenschikov A, Williams C, Zhu SX, Lonning PE, Borresen-Dale AL, Brown PO, Botstein D. Molecular portraits of human breast tumours. Nature. 2000;406:747–752. doi: 10.1038/35021093. - DOI - PubMed
-
- Chin K, DeVries S, Fridlyand J, Spellman PT, Roydasgupta R, Kuo WL, Lapuk A, Neve RM, Qian Z, Ryder T, Chen F, Feiler H, Tokuyasu T, Kingsley C, Dairkee S, Meng Z, Chew K, Pinkel D, Jain A, Ljung BM, Esserman L, Albertson DG, Waldman FM, Gray JW. Genomic and transcriptional aberrations linked to breast cancer pathophysiologies. Cancer Cell. 2006;10:529–541. doi: 10.1016/j.ccr.2006.10.009. - DOI - PubMed
-
- Neve RM, Chin K, Fridlyand J, Yeh J, Baehner FL, Fevr T, Clark L, Bayani N, Coppe JP, Tong F, Speed T, Spellman PT, DeVries S, Lapuk A, Wang NJ, Kuo WL, Stilwell JL, Pinkel D, Albertson DG, Waldman FM, McCormick F, Dickson RB, Johnson MD, Lippman M, Ethier S, Gazdar A, Gray JW. A collection of breast cancer cell lines for the study of functionally distinct cancer subtypes. Cancer Cell. 2006;10:515–527. doi: 10.1016/j.ccr.2006.10.008. - DOI - PMC - PubMed
Publication types
MeSH terms
Substances
Grants and funding
LinkOut - more resources
Full Text Sources
Other Literature Sources
Medical
Research Materials
Miscellaneous
