

Comparison of the cytokine and chemokine dynamics of the early inflammatory response in models of burn injury and infection
- PMID: 21652218
- PMCID: PMC3148335
- DOI: 10.1016/j.cyto.2011.05.010
Comparison of the cytokine and chemokine dynamics of the early inflammatory response in models of burn injury and infection
Abstract
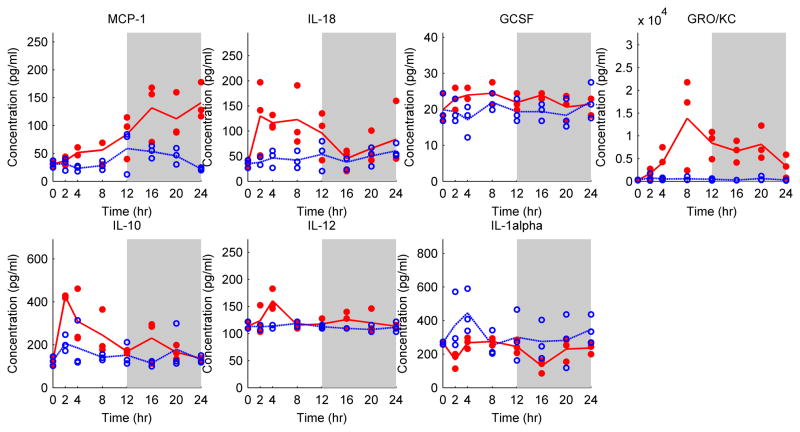
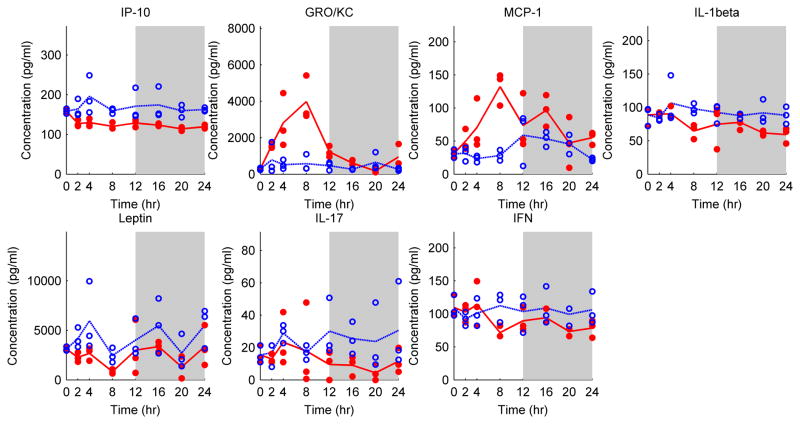
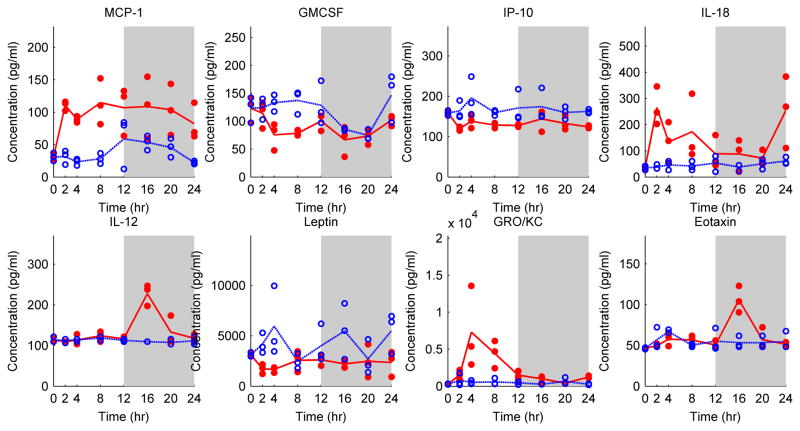
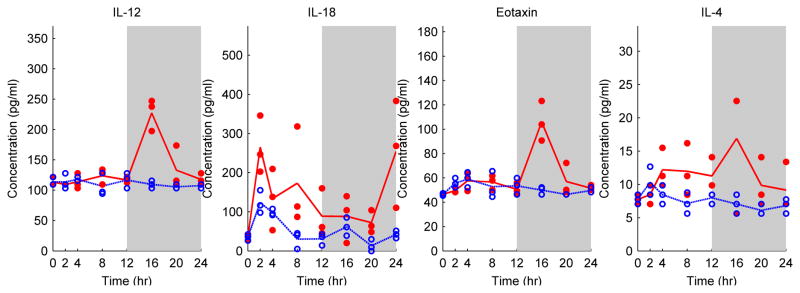
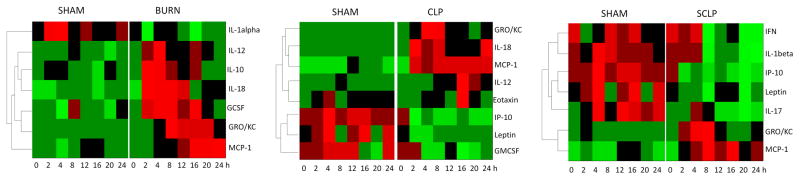
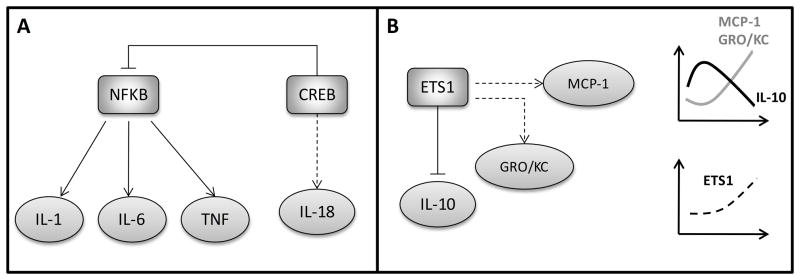
The inflammatory response, and its subsequent resolution, are the result of a very complex cascade of events originating at the site of injury or infection. When the response is severe and persistent, Systemic Inflammatory Response Syndrome can set in, which is associated with a severely debilitating systemic hypercatabolic state. This complex behavior, mediated by cytokines and chemokines, needs to be further explored to better understand its systems properties and potentially identify multiple targets that could be addressed simultaneously. In this context, short term responses of serum cytokines and chemokines were analyzed in two types of insults: rats receiving a "sterile" cutaneous dorsal burn on 20% of the total body surface area (TBSA); rats receiving a cecum ligation and puncture treatment (CLP) to induce infection. Considering the temporal variability observed in the baseline corresponding to the control group, the concept of area under the curve (AUC) was explored to assess the dynamic responses of cytokines and chemokines. MCP-1, GROK/KC, IL-12, IL-18 and IL-10 were observed in both burn and CLP groups. While IL-10 concentration was only increased in the burn group, Eotaxin was only elevated in CLP group. It was also observed that Leptin and IP-1 concentrations were decreased in both CLP and sham-CLP groups. The link between the circulating protein mediators and putative transcription factors regulating the cytokine/chemokine gene expression was explored by searching the promoter regions of cytokine/chemokine genes in order to characterize and differentiate the inflammatory responses based on the dynamic data. Integrating multiple sources together with the bioinformatics tools identified mediators sensitive to type and extent of injury, and provided putative regulatory mechanisms. This is essential to gain a better understanding for the important regulatory points that can be used to modulate the inflammatory state at molecular level.
Copyright © 2011 Elsevier Ltd. All rights reserved.
Figures
Similar articles
-
Long-term dynamic profiling of inflammatory mediators in double-hit burn and sepsis animal models.Cytokine. 2012 May;58(2):307-15. doi: 10.1016/j.cyto.2012.01.017. Epub 2012 Mar 7. Cytokine. 2012. PMID: 22402033 Free PMC article.
-
Dynamics of hepatic gene expression profile in a rat cecal ligation and puncture model.J Surg Res. 2012 Aug;176(2):583-600. doi: 10.1016/j.jss.2011.11.1031. Epub 2011 Dec 15. J Surg Res. 2012. PMID: 22381171 Free PMC article.
-
The dynamics of the early inflammatory response in double-hit burn and sepsis animal models.Cytokine. 2011 Nov;56(2):494-502. doi: 10.1016/j.cyto.2011.07.001. Epub 2011 Aug 6. Cytokine. 2011. PMID: 21824784 Free PMC article.
-
Systemic inflammatory response to exhaustive exercise. Cytokine kinetics.Exerc Immunol Rev. 2002;8:6-48. Exerc Immunol Rev. 2002. PMID: 12690937 Review.
-
Cytokine Pathways in Cardiac Dysfunction following Burn Injury and Changes in Genome Expression.J Pers Med. 2022 Nov 9;12(11):1876. doi: 10.3390/jpm12111876. J Pers Med. 2022. PMID: 36579591 Free PMC article. Review.
Cited by
-
Third-degree hindpaw burn injury induced apoptosis of lumbar spinal cord ventral horn motor neurons and sciatic nerve and muscle atrophy in rats.Biomed Res Int. 2015;2015:372819. doi: 10.1155/2015/372819. Epub 2015 Jan 28. Biomed Res Int. 2015. PMID: 25695065 Free PMC article.
-
Thermal injury lowers the threshold for radiation-induced neuroinflammation and cognitive dysfunction.Radiat Res. 2013 Oct;180(4):398-406. doi: 10.1667/RR3363.1. Epub 2013 Sep 23. Radiat Res. 2013. PMID: 24059681 Free PMC article.
-
Comparison of systemic inflammation response and vital organ damage induced by severe burns in different area.Int J Clin Exp Pathol. 2015 Jun 1;8(6):6367-76. eCollection 2015. Int J Clin Exp Pathol. 2015. PMID: 26261512 Free PMC article.
-
Endogenous Uteroglobin as Intrinsic Anti-inflammatory Signal Modulates Monocyte and Macrophage Subsets Distribution Upon Sepsis Induced Lung Injury.Front Immunol. 2019 Oct 1;10:2276. doi: 10.3389/fimmu.2019.02276. eCollection 2019. Front Immunol. 2019. PMID: 31632392 Free PMC article.
-
To Treat or Not to Treat: The Effects of Pain on Experimental Parameters.Comp Med. 2017 Dec 1;67(6):469-482. Comp Med. 2017. PMID: 29212578 Free PMC article. Review.
References
-
- Tracey KJ. The inflammatory reflex. Nature. 2002;420:853–9. - PubMed
-
- Evers LH, Bhavsar D, Mailander P. The biology of burn injury. Exp Dermatol. 2010;19:777–83. - PubMed
-
- Summer GJ, Romero-Sandoval EA, Bogen O, Dina OA, Khasar SG, Levine JD. Proinflammatory cytokines mediating burn-injury pain. Pain. 2008;135:98–107. - PubMed
-
- Ono I, Gunji H, Zhang JZ, Maruyama K, Kaneko F. A Study of Cytokines in Burn Blister Fluid Related to Wound-Healing. Burns. 1995;21:352–5. - PubMed
-
- Correa SG, Maccioni M, Rivero VE, Iribarren P, Sotomayor CE, Riera CM. Cytokines and the immune-neuroendocrine network: What did we learn from infection and autoimmunity? Cytokine Growth Factor Rev. 2007;18:125–34. - PubMed
Publication types
MeSH terms
Substances
Grants and funding
LinkOut - more resources
Full Text Sources
Medical
Miscellaneous
